Bitcoin Slides to $74K on Middle East Tensions, Miner Stress and Cycle Weakness Weigh
Bitcoin fell toward the $74,000 range this week, caught between geopolitical turbulence, a fresh wave of liquidations, and growing debate
Quick overview
- Bitcoin fell to around $74,000 this week due to geopolitical tensions and a wave of liquidations.
- The cryptocurrency's correlation with the S&P 500 has increased significantly, indicating a shift towards traditional risk sentiment.
- Michael Saylor's company plans a major Bitcoin acquisition, having raised $1.76 billion for purchases amid market pessimism.
- Concerns about the current market cycle's performance compared to previous cycles are growing, with analysts noting a decline in miner financial health.
Bitcoin BTC/USD fell toward the $74,000 range this week, caught between geopolitical turbulence, a fresh wave of liquidations, and growing debate over whether the current market cycle has fundamentally changed.
The biggest cryptocurrency in the world fell almost 1.7% in 24 hours to trade about $74,360. This was because of a wave of risk-off sentiment that swept through global markets after Iran closed the Strait of Hormuz, a key oil transit route, and US-Iran peace talks seemed to stall. The move affected a lot of things: the total crypto market cap fell by almost 1.7%, and Bitcoin’s 30-day correlation with the S&P 500 was an impressive 0.94.
This shows that Bitcoin is now following traditional risk sentiment more closely than its own internal dynamics. “This was macro-driven, not Bitcoin-specific,” one analyst said. The flight from risky assets caused a chain reaction of leveraged long liquidations, with $83.51 million in Bitcoin holdings forcefully closed within 24 hours—a 59% jump—of which $67.3 million were long bets that went bad. Perpetual funding rates went down, which meant that the futures market had turned bearish in the short run.
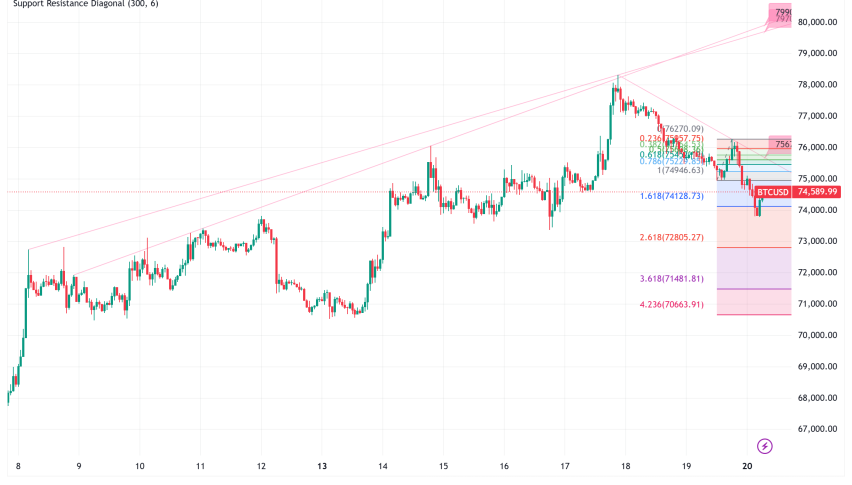
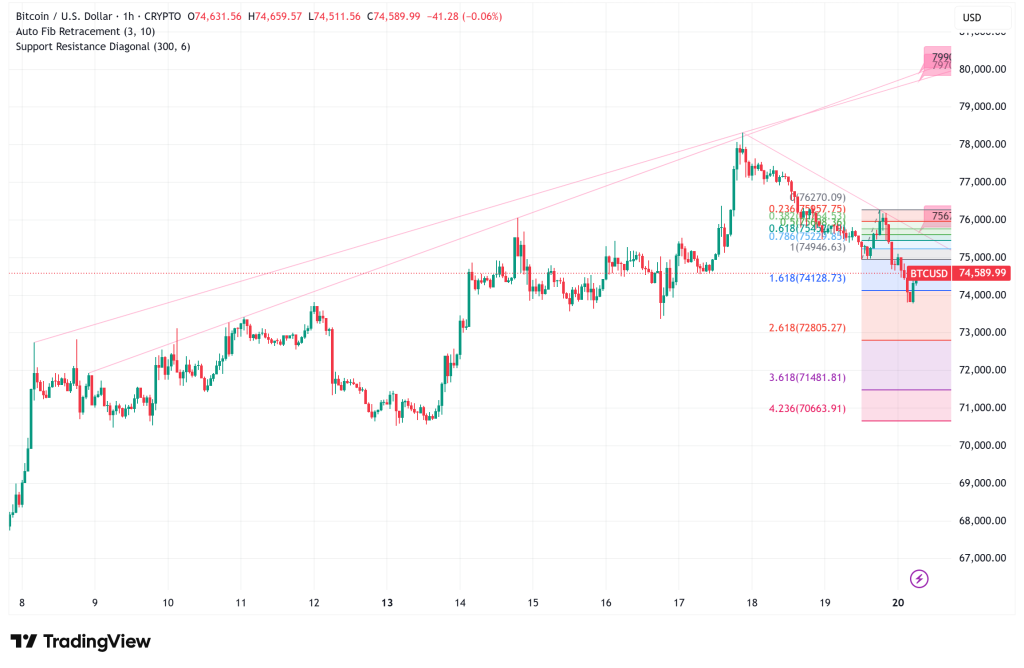
Bitcoin is currently testing the 38.2% Fibonacci retracement line, which is close to $73,221. If it holds there and tensions in the Middle East ease up, it might lead back to the $75,170–$76,307 level. If it breaks below that support, though, the $71,646 level—the 50% retracement—would be open. The market is currently in headline-driven mode.
Strategy Signals Plans for Next BTC Buy, Raises $1.76B
Michael Saylor’s strategy said that its next big Bitcoin acquisition may be its biggest yet, even though the market was pessimistic. The executive chairman of the company uploaded his famous “Orange Dots” chart on X over the weekend. It shows every Bitcoin purchase Strategy has ever made. The caption said, “Think even Bigger.” People in the crypto world have come to trust that chart as a sign that an acquisition is coming.
The capital looks ready to be used. Strategy’s STRC instrument has raised enough money to buy up to $1.76 billion worth of fresh Bitcoin. The corporation now owns 780,897 BTC, which cost an average of about $75,577 per coin. At current pricing, this is worth over $58 billion. Bitcoin Dominance also broke through a key resistance trendline over the weekend. Analysts warn that if the breakout holds, money could move from smaller coins into Bitcoin.
Miners and Cycle Dynamics Raise Longer-Term Questions
Two structural signs are getting a lot of attention, even though the price movement is very temporary. According to on-chain statistics, Bitcoin’s Miner Financial Health Index is at 27.7%, which is close to the historically important 20% level that has indicated the end of miner capitulation in previous cycles. Analysts say that if the price stays above that level for a long time, it usually means that weaker miners have left, the network is stable, and bearish momentum may be running out.
In the meantime, there is a bigger uncertainty hanging over the market. Alex Thorn, the chief of research at Galaxy, said this week that the current cycle, which started in April 2024, is “dramatically” worse than previous cycles. The 2012 halving cycle made over 9,000% more money, the 2016 cycle made around 3,000% more, and the 2020 cycle made about 761% more. The all-time high for this cycle, which was almost $125,000, was merely a 97% increase over the initial price.
The 30-day Bitcoin Volatility Index is now close to 1.75%, down from a peak of over 9% in April 2020.
Bitcoin’s strange all-time high before the 2024 halving, which was caused by the adoption of US spot ETFs in January 2024, makes it hard to compare cycles in a clear way, critics say. Fidelity Digital Assets also pointed out that in past bear markets, prices fell by 80% to 90%, but this time they have only fallen by a little over 50%, which is what happens to an asset as it matures and becomes less volatile.
- Check out our free forex signals
- Follow the top economic events on FX Leaders economic calendar
- Trade better, discover more Forex Trading Strategies
- Open a FREE Trading Account
- Read our latest reviews on: Avatrade, Exness, HFM and XM
Related Articles


Sidebar rates
Related Posts
