Ethereum at $2,200: Selling Pressure Meets Accumulation Signals
Ethereum (ETH) is in a tough spot in the market right now. On the one hand, short-term bearish technicals are pushing it down, while on the
Quick overview
- Ethereum is currently facing short-term bearish pressure while showing signs of long-term accumulation.
- The cryptocurrency's market share has decreased as investors shift away from altcoins towards Bitcoin and cash.
- Recent institutional interest is indicated by significant net inflows into US spot Ethereum ETFs, suggesting potential price support.
- On-chain data shows a decrease in exchange netflow, indicating that investors are moving ETH to self-custody wallets, which is typically a bullish sign.
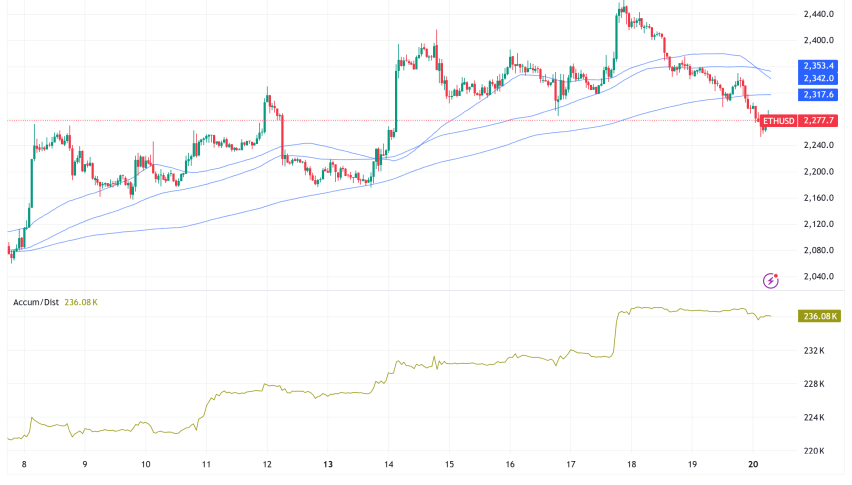
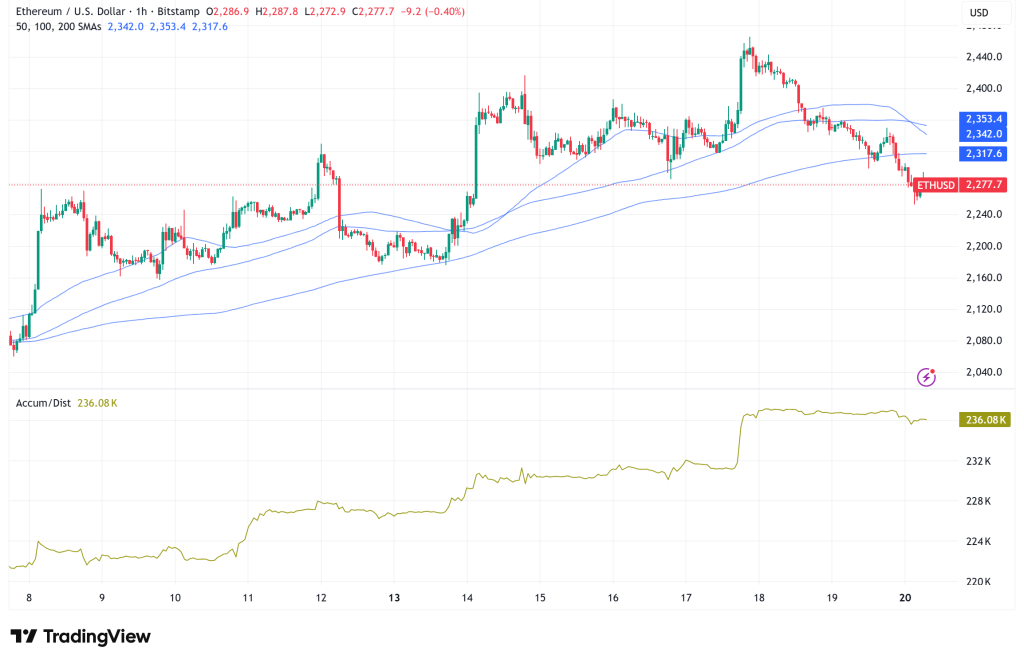
Ethereum ETH/USD is in a tough spot in the market right now. On the one hand, short-term bearish technicals are pushing it down, while on the other hand, more and more on-chain evidence is pointing to a longer-term accumulation phase. The second-largest cryptocurrency in the world by market size is trading about $2,279 at the time of writing. This is down about 2.5% in the last 24 hours. Bulls are getting impatient, but institutional interest is slowly coming back.
A Market Rotating Away from Altcoins
The reason ETH is going down right now isn’t because of Ethereum itself. Analysts say that a lot of money is moving out of cryptocurrencies, and Ethereum’s market share fell from 11.11% to 10.97% in just one day. The Altcoin Season Index is at a neutral 37, which means it has dropped about 20% in the last month. This shows that investors are moving away from riskier crypto assets and back toward Bitcoin or cash.
In the short term, the situation is difficult from a technical point of view. ETH has dropped below its 30-day and 200-day simple moving averages, which are now acting as resistance at levels around $2,317–$2,322. The RSI is around 33, which means the stock is oversold, and the volume is up around 26%. This suggests that technical traders are making the sell-off worse. Analysts say that the daily pivot at about $2,275 is the most important line in the sand. If the price stays below that level, it could open the door to testing deeper support levels.
Institutional Money Quietly Returns
Even if things are rough right now, a more hopeful story is starting to take shape. During the most recent week, US spot Ethereum ETFs had $275.83 million in net inflows, the largest they have seen in a week since mid-January. Analysts are keeping a tight eye on the reintroduction of institutional demand through regulated ETF channels, which might represent a floor for prices.
It’s even more interesting that the derivatives market is changing. According to CryptoQuant analyst Darkfost, buy-side volume has surpassed sell-side volume on derivatives exchanges for the first time this cycle. Recently, a net taker volume reading of +$102 million was reported. A long period of negative net taker volume has been a sign of Ethereum’s recent bearish streak. If that tendency were to change, it could mean that a structural recovery is starting to happen.
On-Chain Data Points to ETH Accumulation
Separate on-chain evidence makes the bull case even stronger. Ethereum’s exchange netflow on Binance has recently dropped to its lowest level since May 2024. This means that investors are consistently moving ETH from exchanges to self-custody wallets, which is a behavior that is more common with long-term holding than short-term selling.
Crypto expert CryptoOnchain wrote on CryptoQuant that this pattern has come before big Ethereum bull runs in the past. The analyst said, “When netflows hit extreme lows on a long-term moving average, it usually means that investors are taking their assets out of exchanges to hold them for a long time, which greatly lowers immediate sell pressure.”
Ethereum Price Outlook: Two Stories, One Price
Ethereum is in a tense time right now, with short-term selling pressure and long-term structural improvement going on at the same time. The short-term trend is still bearish below $2,322, and the overall market situation isn’t good for altcoins yet, with Bitcoin dominance above 59%. But the combination of ETF inflows, a derivatives market shift, and historic accumulation signals on-chain suggest that investors who are willing to wait may be quietly getting ready for the next leg up.
The most important question right now is whether ETH can stay above the $2,275 pivot level long enough for the big picture to catch up with the on-chain tale.
- Check out our free forex signals
- Follow the top economic events on FX Leaders economic calendar
- Trade better, discover more Forex Trading Strategies
- Open a FREE Trading Account
- Read our latest reviews on: Avatrade, Exness, HFM and XM
Related Articles


Sidebar rates
Related Posts
