S&P 500 Analysis: 7,390 ATH After NFP Beats at +115K – Fibonacci Breakout Eyes 7,585
The S&P 500 closed at 7,390 on May 7, setting a new all-time high. Futures are up 0.50% before the market opens after April NFP came...
Quick overview
- The S&P 500 reached a new all-time high of 7,390 on May 7, with futures up 0.50% following a strong April NFP report of +115,000 jobs.
- The April NFP figure indicates a stable labor market, avoiding recession fears while keeping hopes for Fed rate cuts alive.
- Q1 2026 saw the S&P 500's net profit margin rise to 13.4%, driven by strong earnings growth, particularly in Information Technology.
- The market is now favoring companies with real AI revenue, as seen in the contrasting performances of Alphabet and Meta during the earnings season.
The S&P 500 closed at 7,390 on May 7, setting a new all-time high. Futures are up 0.50% before the market opens after April NFP came in at +115,000, well above the +65,000 consensus, with unemployment steady at 4.3%. This result is ideal: it shows the economy is strong but not so strong that it rules out Fed rate cuts. The 1.618 Fibonacci breakout at 7,342 has been confirmed, and the next target is the 2.0 extension at 7,584.
NFP +115,000: Why This Number Is Better Than It Looks
April nonfarm payrolls increased by 115,000, easily beating the 65,000 consensus, while unemployment stayed at 4.3%. This strong result matters not just because of the number, but because of what it avoids. If the number had been below 50,000, recession worries would have grown. If it had been above 200,000, hopes for 2026 rate cuts would have faded. At +115,000—about double the consensus but still below March’s +178,000—the data shows the labor market is cooling gradually, not collapsing. This is the ‘soft landing’ that supports current stock prices.
The S&P 500’s blended net profit margin for Q1 2026 is 13.4%, the highest since FactSet started tracking in 2009. Information Technology led with a 29.1% net margin, up from 25.4% last year. This shows the bull market is backed by real earnings growth, not just higher valuations. The forward 12-month P/E is 20.9x, which is above the five-year average of 19.9x and the ten-year average of 18.9x. While this is high, it is reasonable given the strong profit margins.
This AI earnings season gave bulls what they wanted. Alphabet jumped 34% in April, its best month since 2004, thanks to strong results in cloud, advertising, and Waymo. Meta dropped 9% after raising capital spending, even though it beat earnings. Microsoft fell 4%. The market is now picking winners within Big Tech, rewarding companies that show real AI revenue and punishing those with high spending but no clear returns. This shows a more mature rally compared to the speculative surge in 2021.
Real GDP grew at an annual rate of 2.0% in Q1 2026, up from just 0.5% in Q4 2025. The slowdown caused by shutdowns has now fully reversed, with federal spending and exports leading the recovery.
S&P 500 Technical Analysis: 1.618 Fibonacci Confirmed, 7,584 in Focus
The daily chart shows the S&P moving above the 1.618 Fibonacci extension at 7,342 on strong volume, which is a classic sign of momentum. The upward channel from the March lows remains in place, with no signs of a bearish reversal.
Resistance levels are at 7,400 (psychological), 7,584 (2.0 Fibonacci extension and main target), and 7,757 (2.272 extension). Support is at 7,342 (1.618 Fibonacci and breakout level) and 7,124 (ascending trendline and blue support).
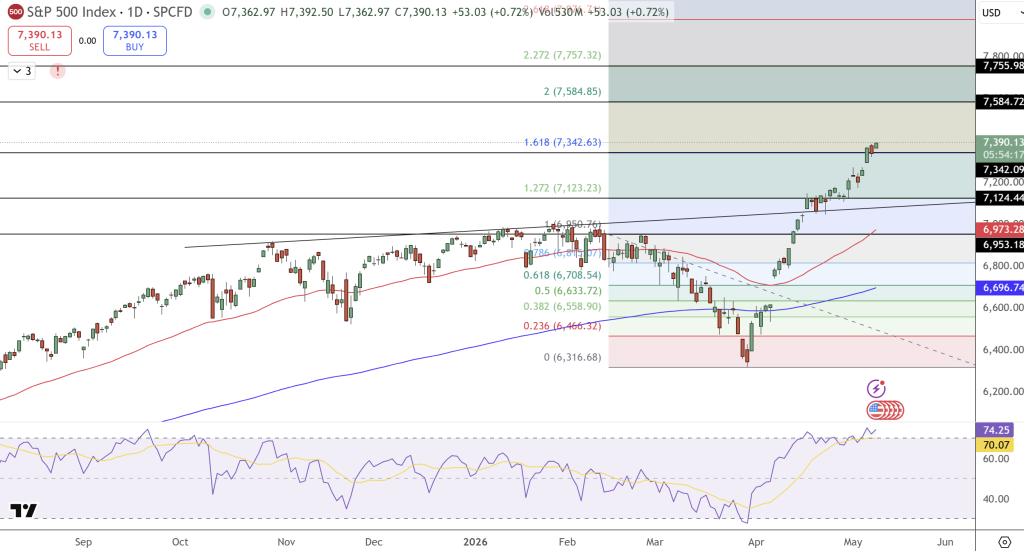
The RSI is high at 70 to 74, but this fits with a confirmed breakout rather than market exhaustion at this point. The VIX at 17.02 shows that complacency is not too high, so there is no euphoria premium that needs to be corrected.
Trade idea: Go long if the price pulls back to between 7,342 and 7,200. Set your target between 7,584 and 7,755, and place a stop below 7,124.
FAQ: S&P 500 — NFP Impact, AI Earnings Season, and the 7,584 Target
Why is a +115,000 NFP print bullish for the S&P 500?
The consensus was +65,000, which would have been too low and might have raised recession fears. A number above 200,000 would have ended hopes for rate cuts. At +115,000, the market gets the ideal result: a strong labor market without triggering tighter policy. CME FedWatch’s June rate cut odds will likely rise after this moderate beat, giving stocks a boost from both earnings growth and the chance of lower rates.
Has the AI bull market broadened beyond mega-cap tech?
In Q1 2026, profit margin growth was mainly in Information Technology at 29.1%, so the rally is still led by tech. Still, the market’s different reactions to Alphabet’s 34% gain (with confirmed AI revenues) and Meta’s 9% drop (due to higher spending without quick returns) show that investors are being more selective. For the rally to spread to industrials, healthcare, and energy, rate cuts will need to happen. The NFP beat keeps that possibility on track.
What is the S&P 500 price target for 2026?
Most Wall Street forecasts are between 7,500 and 7,700, with the Fibonacci move pointing to 7,584 as the next target. If AI monetization and Fed rate cuts go well, some see 8,000 to 8,500 by year-end. The main risk is that if earnings growth slows in the second half, the current 20.9x forward P/E could lead to a drop in valuations. Stocks are priced for the strong Q1 trend to continue, and any slowdown will have a bigger impact at these higher valuations.
- Check out our free forex signals
- Follow the top economic events on FX Leaders economic calendar
- Trade better, discover more Forex Trading Strategies
- Open a FREE Trading Account
- Read our latest reviews on: Avatrade, Exness, HFM and XM
Related Articles
Sidebar rates
Related Posts
