JSE Top 40 Surges 0.85% to 106,382 – Commodities & Global Risk Sentiment Lift Index?
On May 20, 2026, the FTSE/JSE Top 40 Index hovered around 106,382.5 ZAR, registering a 0.85% gain during the session. Its uptrend...

Quick overview
- On May 20, 2026, the FTSE/JSE Top 40 Index gained 0.85%, reaching approximately 106,382.5 ZAR.
- The index's uptrend was supported by strong performances on Wall Street and easing US-Iran tensions.
- Mining and resource stocks, along with an appreciating rand, contributed positively to the index's performance.
- Technical analysis indicates potential for further gains, with key resistance levels identified between 108,704 and 111,336.
On May 20, 2026, the FTSE/JSE Top 40 Index hovered around 106,382.5 ZAR, registering a 0.85% gain during the session. Its uptrend continued to gain momentum, extending the index’s run of late recovery.
Drivers for today included an improved risk environment as the JSE picked up gains on strong Wall Street performances and easing tensions regarding the US-Iran ceasefire.
Mining and resource stocks such as AngloGold Ashanti, Gold Fields, Impala Platinum and Sibanye Stillwater also helped the gains; with firmer prices in precious metals as well as sustained central bank purchases, this sector had clear support. Additionally, an appreciating rand provided some benefits to exporters while reducing exposure to imports.
Elsewhere, Naspers/Prosus and Richemont fared well with the emerging markets. Banking and consumer shares posted uneven results as the positive sentiment on global markets was balanced by caution on domestic economic figures.
The JSE continues to rely on its high concentration of resource and commodity names, which has provided it with continued support, despite it still remaining exposed to crude oil prices, currency strength in the rand and the global environment.
JSE Top 40 Technical Analysis
The index has just made a bullish hammer pattern on the 4H after testing a downtrend resistance structure (black) from the April highs around 107,800 to 108,700 and a dynamic support from the blue MA around 107,843 to 108,704. Current price is currently above a red MA which is located at 107,819, and is printing higher lows within this overall downtrend channel.
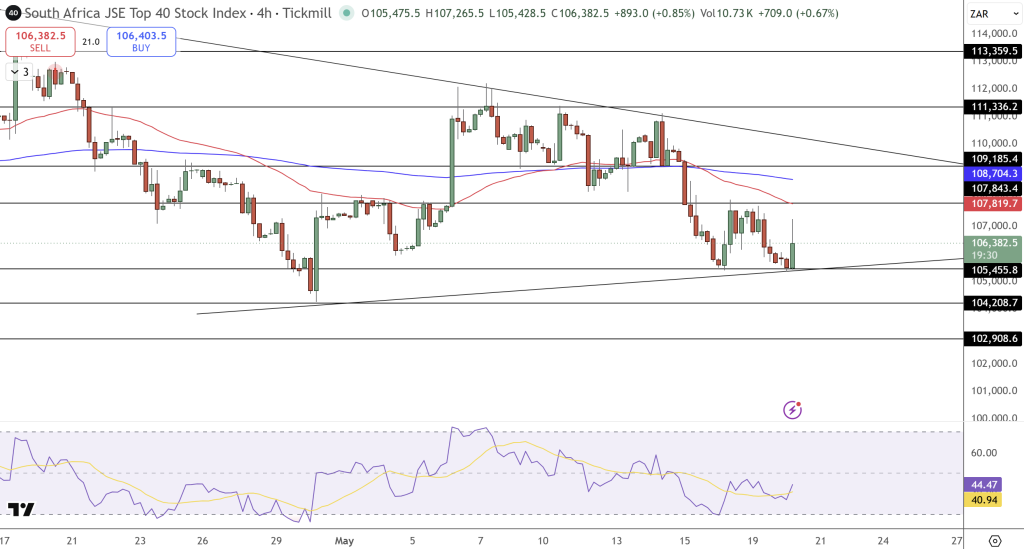
It is showing control within the consolidation and has yet to test below a triangle structure nor an engulfing bearish. The recent bullish impulsive leg broke above resistance and has now pulled back into a flag that appears to be defending the 0.236 to 0.382 Fib area as seen in the price action and the MA structure.
This pattern shows positive divergence from the seller perspective (RSI has not dropped into overbought territory) and a potential for continuation. 107,843 to 108,704 is next with 109,185 to 111,336 higher still as the next key price areas to watch.
- Resistance levels are 108,704 → 109,185 → 111,336.
- Support levels are 105,455 → 104,208.
The suggestion is a buy above 106,800 to target 108,704 to 109,185 with a stop at 105,400. While short-term fluctuations remain related to events abroad, the resource-heavy weighting of the JSE still provides some sensitivity to gold and energy markets.
- Check out our free forex signals
- Follow the top economic events on FX Leaders economic calendar
- Trade better, discover more Forex Trading Strategies
- Open a FREE Trading Account
- Read our latest reviews on: Avatrade, Exness, HFM and XM
Related Articles


Sidebar rates
Related Posts
