Gold Price Forecast: $3,960 Floor Defended as Swiss Accord Erases War-Risk Premium
The global precious metal markets are currently going through an intense technical phase of stabilization. The markets are grappling...
Quick overview
- The global precious metal markets are stabilizing amid significant geopolitical changes and a restrictive monetary policy from the U.S.
- Spot gold has found a narrow value pocket around $3,993.63/oz, with institutional investors cautiously accumulating for long-term positions.
- The U.S.-Iran peace agreement has normalized energy transport, reducing the war premium in commodity prices and impacting gold's value.
- Despite short-term trading fluctuations, central banks continue to diversify reserves into gold, providing a price floor against deep sell-offs.
The global precious metal markets are currently going through an intense technical phase of stabilization. The markets are grappling with the significant liquidation of geopolitical war premiums against the backdrop of the monetarist pivot which is aggressively restricting money flows coming out of Washington. Spot gold (XAU/USD) found an intraday value pocket, which was extremely narrow, around $3,993.63/oz during the early afternoon trading on Thursday, June 25, 2026. In this highly compressed discount area, institutional investment houses and central bank desks are cautiously adding to some automated accumulation blocks for long-term defensive allocation while short-term positions are still unwinding and unwinding.
Swiss Signing Ceremony Safely Uncools Global Safe-Haven Premium
The main fundamental driver that is influencing the current decline in the precious metal complex is the rapid commercialization of the U.S.-Iran interim peace agreement referred to as the “Islamabad Memorandum of Understanding.” After the public and very significant signature ceremony in Switzerland on June 19, the transit of commercial ships through the crucial Strait of Hormuz was quickly normalized and this helped push the near month Brent crude price index to the lower $73/barrel levels.
The complete resumption of energy transport logistics for the region was the key reason for the war-premium which was so prominent in commodity prices due to fear.
However, the structural global investors point out that while the tension and the hostilities in other secondary theaters in the Middle East continue, they will continue to deter aggressive short-selling expansion and maintain the gold as a true store of value in portfolio allocation.
The Warsh Doctrine Hardens Capital Carry Costs for Non-Yielding Assets
The immediate prospects for structural recovery of most other asset classes were further curtailed due to the extremely monetary policy which was adopted at the June 16-17 FOMC meeting, in what is being referred to as the inauguration of a new era under new Federal Reserve Chairman Kevin Warsh. With a hot inflation print of 4.1% in April on the core CPI and 3.8% in the headline CPI, Chairman Warsh is putting a priority on price stability by eliminating all the dovish forward guidance from previous years and even removing the expectations of interest rate reductions for autumn 2026.
As a result of a clear and deliberate “high-for-longer” policy stance, the U.S. Dollar Index (DXY) as well as the real U.S. Treasury yield curve have had a significant structural support from these higher interest rates. Since the non-interest yielding physical bullion has an inherent opportunity cost which is elevated by the higher riskless yields, this allowed a rational repricing of the paper futures markets with a significant correction in gold spot prices down to their fundamental value of the cost of replacement.
Persistent Sovereign Reserve Diversification Limits Long-Term Downside Exposure
Notwithstanding the tactical movements by short term trading desks in response to central bank rate moves, the physical market for gold continues to be insulated from the long-term investment community. The central bank of China (PBOC) continued to add to its non-disclosed stockpile of physical bullion for well over 17 months now.
In addition, many emerging market central banks have been systematically moving their sovereign reserves away from traditional G7 currencies and into bullion as a hedging strategy to counter volatility in global currencies and the increasing use of financial sanctions. Because of this price-independent demand for the asset from major central banks, there is a guaranteed floor to the asset’s price which will prevent deep sell-offs even when the dollar is strong.
Technical Analysis: XAUUSD Tests Dynamic Support Base in Deeply Oversold Channel
Turning to a more technical picture, this is the 2H chart of the spot gold price which shows that the most recent decline has come right into the major consolidation area in the price chart. XAU/USD is demonstrating explicit dynamic defense along its primary black descending trendline.
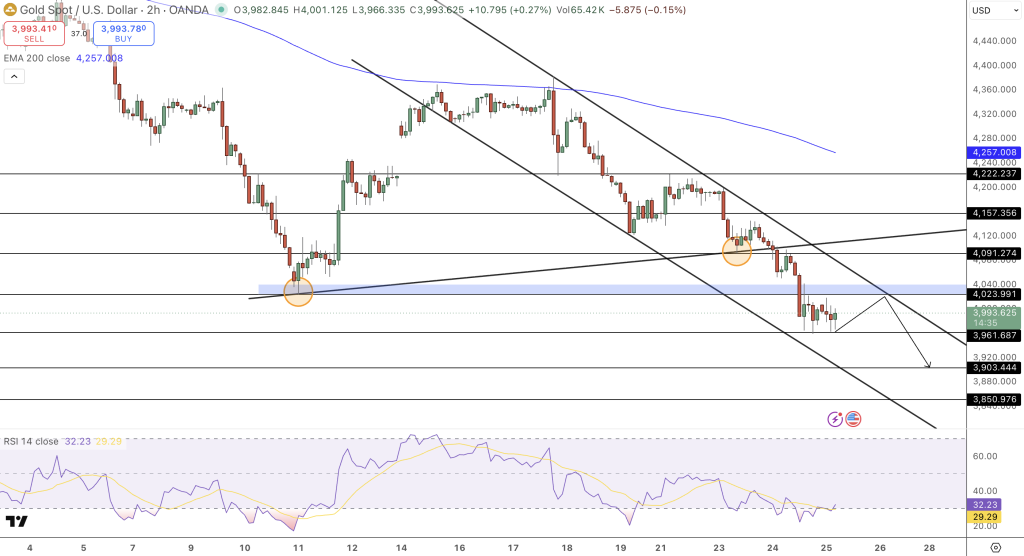
The price action is now near the lowest end of this pattern and there are multiple points of contact (denoted as the orange circles on the chart below) with the trendline indicating a strong buying interest in this zone, which is below the trailing 2H EMA200 at $4,257.01.
The 14-period RSI index is in an extremely low range of 32 in terms of its oscillation and it is in an oversold range, implying that the sellers are losing strength and the MACD is also starting to show a bit of a bottoming out and the price seems likely to mean-revert.
Conclusion and Trade Idea
The recent decline in spot gold is a normal correction process of prices following the changes in the macro-economic setting and a shift to a more hawkish Fed policy. Kevin Warsh’s firm interest rate policy is going to lead to a continuation of higher levels of borrowing rates in general over the short term but this will not change the fact that a sustained 17 month period of sovereign bullion accumulation exists in the markets.
Tactical Buy: Buy in spot gold with a 2H time frame after it breaks above the descending trend line support resistance zone at $3,961.69. A protective stop-loss order should be placed at $3,903.44 and a buy side target should be set at $4,091.27 with further potential gains extending into the 0.382 Fibonacci retracement level at $4,157.36.
- Check out our free forex signals
- Follow the top economic events on FX Leaders economic calendar
- Trade better, discover more Forex Trading Strategies
- Open a FREE Trading Account
- Read our latest reviews on: Avatrade, Exness, HFM and XM
Related Articles

Sidebar rates
Related Posts
