WTI Crude Oil Price Forecast: $68.71 Trendline Base Buckles Under New Wave of Post-Treaty Iranian Cargo Liftings
West Texas Intermediate Crude Oil (USOIL) has seen continuous selling into the institutional desks on Friday, July 3, 2026, trading...
Quick overview
- West Texas Intermediate Crude Oil is experiencing significant selling pressure, trading just under $68.71/bbl as institutional traders re-weight their positions.
- The recent U.S.-Iran Interim Peace Treaty has alleviated supply concerns, leading to a reopening of the Hormuz Corridor and a restoration of commercial shipping.
- OPEC+ is poised to increase production amid rising non-OPEC output, while demand growth projections remain modest due to economic factors.
- Tight monetary policy from the Federal Reserve is likely to cap any near-term price rebounds, as the market adjusts to oversold conditions and tests key support levels.
West Texas Intermediate Crude Oil (USOIL) has seen continuous selling into the institutional desks on Friday, July 3, 2026, trading just under $68.71/bbl for an extended time. The commercial traders and commodity index managers are re-weighting the book heavily and have pushed the price of these benchmarks down well below the significant cyclical levels, as the physical multi-million barrels of inventory come into market during the start of the new quarter and the safe havens are liquidated.
Swiss Accord Reopens Hormuz Corridor and Deflates the War-Risk Premium
The primary fundamental driver of the persistent short-term drop in crude benchmarks is the proper implementation of the U.S.-Iran Interim Peace Treaty, known by the official nomenclature the Islamabad Memorandum of Understanding (US-Iran MoU).
Executed through official Pakistani diplomatic negotiations on June 19 in Switzerland, the accord has effectively ended the supply anxiety associated with energy derivatives throughout the current quarter and beyond.
Specifically, with the U.S. Navy lifting the blockade in full force and the critical corridor of the Hormuz Strait re-opened for commercial shipping, commercial maritime tankers have been restored to some 85% of seasonal norms.
Industry and commercial data confirm Iranian cargo is being lifted with no issue as the first diplomatic shipments roll into the new regime and the overstocked inventory is dumped from floating storage to the refinery gate in Europe and Asia.
OPEC+ Voluntary Cut Rollbacks Intersect Record Non-OPEC Production Buffers
Another element in the equation is OPEC+ and its ability to control the market in the near term. Even while they held their discipline for the crisis, now that the Iranians barrels are coming back into the fold, a number of members are in position to move up their previously planned increases. They are scheduled to raise by approximately +188k bbl/d in July as they begin to roll-back some of their voluntary cuts.
This domestic volume coming back on stream is not an attractive time to increase output as they need to watch their discipline in the next ministerial meeting to make sure they do not run afoul of a supply overhang. Notably, non-OPEC output is also at an all-time high.
U.S. oil and gas continues to hold at near record levels, and we are seeing significant growth in the oil sector in Guyana, Brazil, and Canada. This supply volume continues to outgrow demand in the international markets.
OPEC has projected demand will grow by approximately 1.2 million bbl/d in 2026 while the IEA projected the demand will be similar on a year-over-year basis as a result of efficiency gains from lower prices and a continued drag on economic growth in the OECD.
The Warsh Doctrine Extends High Financing Hurdles for Commercial Commodity Desks
Any rebound in demand-driven prices in the near term will likely be capped by the incredibly tight monetary policy put in place by Federal Reserve Chairman Kevin Warsh at the close of the Fed’s June 16-17 meeting on the FOMC.
Amid continuing, underlying price pressures where U.S. core inflation continues to hold steady at 4.1% and headline CPI is currently at 3.8%, Chairman Warsh took a data dependent, rigid monetarist approach to the Fed’s role at the rate-setting body’s meeting, removing any expectations for cuts to U.S. rate policy.
Speaking at the ECB Forum on Central Banking held this week in Sintra, Portugal, Chairman Warsh made it clear that he wants a clear separation between the Federal Reserve and fiscal policy with a clear focus on a rules-based, 2% inflation target, and he also announced a commitment to a “higher-for-longer” rate outlook.
This approach is keeping real rates and the U.S. Dollar Index (DXY) at fresh multi-month cyclical highs, since physical crude traded globally in USD terms makes crude more expensive for non-U.S. sovereign refiners and also suppresses global industrial margins and speculative longs on the crude market.
Technical Analysis: USOIL Slams Into Long-Term Upward Trendline Support Floor
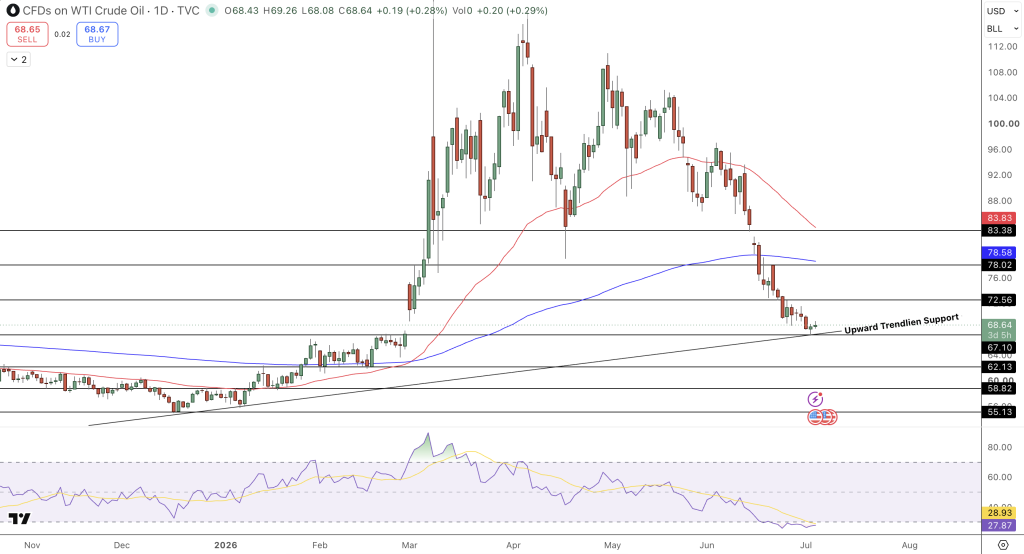
Now, leaving aside the question of monetary policy, and focusing on the USOIL oil daily technical price chart, WTI Crude Oil has finished a multi-month move downward after reaching new historical highs near $112, and has now set up a consolidation range directly above its key underlying support.
As seen in the 24-hour USOIL oil chart at the end of trading Wednesday, the USOIL oil price is testing a key long term support dynamic on the Daily 24-hour chart, currently sitting on $68.71 as it tests the underlying upward trendline support floor.
Price is also blocked below a major descending trendline originating from previous macro highs, preventing it from clearing the daily 200-ema (currently sitting at $79.53) to the upside.
The 14 period RSI index on the Daily chart shows deep signs of being fully oversold, with the oscillator indicator currently printed as low as 28.94, a signal that selling volume from the short-term down-leg move has likely peaked, with early signs of stabilization appearing on the MACD histogram, suggesting the initial rate of decline from the price crash may be slowing as USOIL finds a structural bottom near the $67.10 horizontal pivot line.
Conclusion and Trade Idea
Crude Oil enters an aggressively post-geopolitical normalisation phase of price discovery as it sheds its war-risk premium, putting it back at the mercy of global supply expansions, and for now, while Chairman Kevin Warsh’s aggressive rate-setting keeps the global commercial trading desk short-fund, the technical reality that USOIL is oversold off a Daily chart test of its trendline support suggests that the initial rate of down-leg move has found a structural demand level.
Tactical Breakout Blueprint:
Trade longs only once USOIL price breaks above the immediate structural horizontal resistance barrier and descending trendline intersection at $72.51 on a confirmed Daily close. Keep a tight, trailing stop-loss order under the horizontal structural invalidation zone at $67.10, targeting the previous horizontal support level at $74.45 for a first order stop-cover rally, and look for USOIL oil to make a second leg move to retest a horizontal supply ceiling at $78.07.
- Check out our free forex signals
- Follow the top economic events on FX Leaders economic calendar
- Trade better, discover more Forex Trading Strategies
- Open a FREE Trading Account
- Read our latest reviews on: Avatrade, Exness, HFM and XM
Related Articles

Sidebar rates
Related Posts
