Gold Price Forecast: Central Banks Defend $4,168 Base Against Aggressive Fed Drag
Global precious metal markets have tightened into a technically compressed stabilization phase, with the massive unwinding of geopolitical..

Quick overview
- Global precious metal markets are stabilizing as geopolitical tensions ease, leading to a selloff in precious metals.
- Spot gold has shown strong support at $4,168.07, indicating potential for a recovery bounce amid high capital carrying costs.
- The U.S.-Iran Interim Peace Treaty has significantly impacted the supply/demand balance, allowing for increased maritime trade.
- Central banks, particularly the People's Bank of China, continue to accumulate physical gold, providing structural support against market volatility.
Global precious metal markets have tightened into a technically compressed stabilization phase, with the massive unwinding of geopolitical war premiums offsetting a very tight monetarist shift in Washington.
On Friday, July 3 2026, spot gold (XAU/USD) put together a hard intraday consolidation plateau in the late afternoon session, trading in the $4,168.07 per troy ounce area.
Institutional money management committees and central bank desks are strategically placing automated block-buy orders in this localized value trough, putting down an early foundation price for the beginning of the new quarter as some of the short-term futures speculators continue to cover up.
Swiss Signing Ceremony and General License X Deflate Safe-Haven Greenback Premium
The biggest fundamental driver behind the immediate selloff in precious metals is the on-going expansion of the U.S.-Iran Interim Peace Treaty, the Islamabad Memorandum of Understanding (US-Iran MoU).
Executed on June 17, 2026 by US President Donald Trump and Iranian President Masoud Pezeshkian and negotiated by Pakistani Prime Minister Shehbaz Sharif, the fourteen-point agreement has put an end to the severe military hostilities that began earlier in the year.
Major developments affecting the global supply/demand balance have included the passing of General License X by the US Treasury’s Office of Foreign Asset Control (OFAC). This temporary 60-day sanction waiver has lifted the maritime blockade and allowed for insured maritime energy trade through August 21, 2026.
As commercial shipping activity through the strategically important Strait of Hormuz has returned to approximately 85% of average peak capacity, near-term Brent crude benchmarks have broken through the $73 per barrel price level.
The subsequent price normalization has removed much of the crisis-driven war premium from the futures paper contracts and has cooled the panic-driven flows into precious metals during the period of Middle East military conflict.
The Warsh Doctrine Hardens Capital Carrying Costs
Another important structural constraint on potential recovery in the alternative asset allocation portfolio network remains the aggressive monetary stance by Federal Reserve Chairman Kevin Warsh.
Since his swearing in on May 22 2026 and after facing a 4.1% year-over-year core CPI print and 3.8% headline inflation level, Chairman Warsh at the June 16-17 2026 FOMC meeting established a very disciplined monetarist framework that eliminated the previous dovish policy statements and cut expectations for any rate reduction later this year.
With the federal funds rate maintained at its all-time high and the Fed projecting for the interest rate path to increase, the Warsh Fed has succeeded in pushing U.S. Treasury real yields and the U.S. Dollar Index (DXY) back to all-time cycle highs.
Higher risk-free capital carrying costs have increased the opportunity cost of holding non-yielding physical assets and are forcing institutional portfolio rebalancing to redirect funds out of commodities as investors capture the elevated risk-free returns on sovereign debt.
17-Month Sovereign Buying Streak Seals a Defensible Physical Replacement Zone
In addition to short-term paper trading desks reacting to central bank rate decisions, gold’s physical marketplace infrastructure has continued to receive significant protection from long-term, non-retail buyers. The People’s Bank of China (PBOC) has formally extended its aggressive, unannounced physical accumulation run now well above 17 consecutive months.
In parallel, widespread emerging-market central banks are moving national currency reserves out of G7 fiat debt and into physical bullion to defend against monetary instability and weaponized monetary tools.
This unwavering and price-indifferent central bank demand guarantees a lasting structural support that forestalls deeper sell-offs in times of dollar breakout momentum, locking into place an underlying fact that long-term accumulation easily offsets near-term paper release.
Technical Analysis: Spot Gold Spotlights Strong Rejections Along Triple Bottom Floor
Shifting attention away from fundamental macroeconomic headlines, from the daily price chart, spot gold’s multi-month slide from all-time highs has brought price directly to a very established support setup.
XAU/USD is displaying clear structural support along its major horizontal support level, clearly laying out a key Triple Bottom Pattern at $4,168.07. Recent daily candles have been wick rejections from the base support, indicating strong buy-side absorption below the macro Daily 200-EMA ($4,349.00).
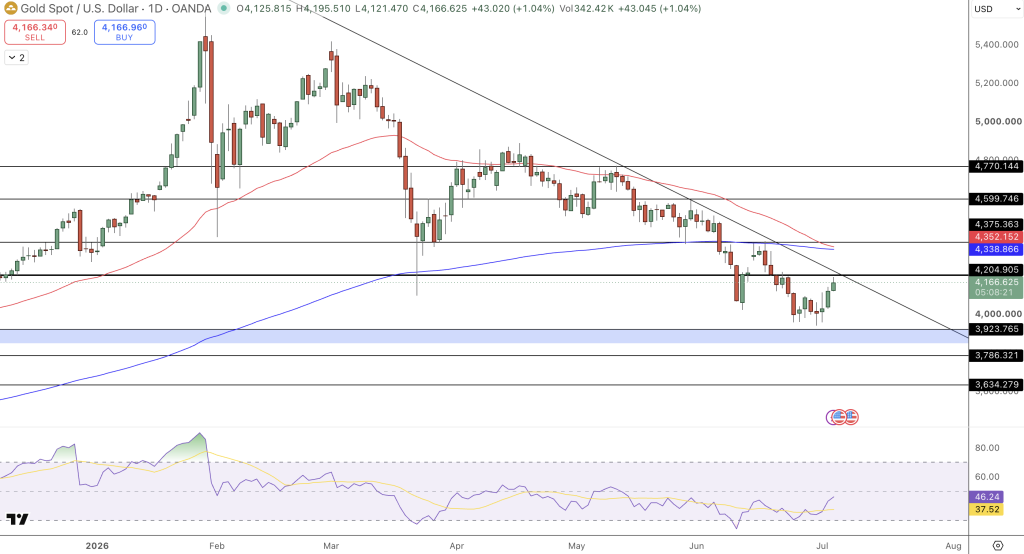
The 14-period RSI has stalled in a constricted print at 37.53, reflecting that near-term selling momentum has reached mathematical extremes with room for a multi-week recovery bounce. This is reinforced by the MACD histogram printing early positive support bars around its zero line, which shows that structural pace of the post-treaty markdown has slowed.
Conclusion and Trade Idea
Spot gold is in a required macro reset after significant geopolitical developments and the shift to Fed Chair Kevin Warsh. While a rate-holding stance will continue to make broader market financing rates high in the near-term, the structural factor of a continuing 17-month sovereign buying streak keeps the asset fundamentally sound around the triple bottom base.
Tactical Breakout Plan:
Go long on confirmed daily candlestick close and breakout through the immediate horizontal resistance wall and downward sloping trendline nexus at $4,204.00. Maintain a strict protective stop-loss order placed safely below the localized validation floor at $4,091.00, aimed for short-covering rebound toward the past horizontal support at $4,251.00, followed by further technical targets to the horizontal resistance at $4,313.00.
- Check out our free forex signals
- Follow the top economic events on FX Leaders economic calendar
- Trade better, discover more Forex Trading Strategies
- Open a FREE Trading Account
- Read our latest reviews on: Avatrade, Exness, HFM and XM
Related Articles


Sidebar rates
Related Posts
Ava

