Silver Price Forecast: Bears Weaponize Triangle Breakdown as Fed Drag Mutes 46M Oz Deficit
Global commodity derivatives markets are aligning structurally in an aggressive fashion to early July 2026, requiring alternative safe-haven

Quick overview
- Global commodity derivatives markets are experiencing structural alignment ahead of July 2026, prompting a search for alternative safe-haven assets.
- Spot silver has faced significant liquidation pressure, dropping to around $57.53 per troy ounce as geopolitical premiums diminish.
- The recent US-Iran peace accord has led to a recovery in commercial shipping and a drop in energy prices, impacting precious metal valuations.
- Despite a persistent physical silver shortfall, bearish market conditions and elevated borrowing costs are expected to continue pressuring silver prices.
Global commodity derivatives markets are aligning structurally in an aggressive fashion to early July 2026, requiring alternative safe-haven stores-of-value to weather an intense near-term valuation decompression.
On Friday, July 3, spot silver (XAG/USD) came under significant liquidation pressure by commercial hands and slipped below multiple moving average lines to trade near $57.53 per troy ounce. As the new quarter opens, quantitative macro funds and institutional end-producers are busy re-rating their books to price-in a full elimination of geopolitical premiums into a very restrictive interest rate environment at the US White House.
Islamabad MoU Reshapes Maritime Energy Costs and Lightens Precious Metal Hedges
The primary fundamental driver for the immediate bearish price translation of precious metals is the growing deployment of the U.S.-Iran Interim Peace Accord known as the Islamabad Memorandum of Understanding (US-Iran MoU). Signed June 19 in Switzerland, the landmark 14-point diplomatic treaty formally ends the regional military clash that raged in the first two months of Q2.
The reopening of the Strait of Hormuz since the signing of the treaty has led to a fast recovery of commercial shipping capacity back to around 85% of seasonal levels.
As a result, front-month Brent crude benchmarks have collapsed below $73 per barrel, which has in turn forced the unwinding of the very short-lived but intense war premium that was previously supporting paper commodity contracts.
While the peace accord has cooled the inflow of safe-haven assets into precious metals, this decrease in global energy overhead will lead to structural savings for large manufacturing centers across Asia and Europe, which will ultimately be helpful for the non-gold half of silver over the next couple of months.
The Warsh Fed Framework Imposes Punishing Carrying Costs on Non-Yielding Assets
Restricting near-term bounce attempts across other alternative stores-of-value is the US Federal Reserve Chair Kevin Warsh and a very restrictive monetary policy setup. Chair Warsh strongly reinforced the Fed’s political independence during his recent July 1 remarks on the “The ECB Forum on Central Banking in Sintra, Portugal” stage, while at the same time shutting the door on the premature rate cuts sought by the White House.
Warsh is standing by his very conservative inflation guidance framework and the Federal Reserve’s 2% annual inflation target, as it was confronted with a 4.2% inflation print for May due to lingering wartime oil prices.
Even though Warsh noted that inflation has eased slightly over the past month following a retreat of oil, which allowed Treasury rates and the US dollar to give back some of their steep gains, the US Fed’s monetary policy framework remains tight.
Traders are dropping any expectations for a cut in autumn, and are now expecting rate hikes as soon as October to maintain price levels. This higher for longer interest rate framework has resulted in higher real yields for US Treasuries and keeps the cost of carry on all other non-interest bearing asset classes elevated, which is helping to hold down US index speculations.
Six-Year Physical Shortfall Counterbalances Record Solar Thrifting
The dichotomy between immediate paper liquidation and long-term physical shortage continues to serve as the major fundamental underpinning of the silver bull market. Revised worldwide survey data compiled by The Silver Institute’s World Silver Survey 2026 has revealed that the physical silver market is continuing to experience a physical deficit for the sixth straight year, with a 46.3 million troy ounce shortfall forecast for all of 2026.
With some 72% of world-wide mineral output directly dependent on secondary byproduct processing derived from the primary operations of copper, zinc and lead, mining output is poised to post negligible year-over-year change of plus 1%, to 820 million ounces, which completely negates the ability of the supply-side to rapidly respond and capture the structural shortfall.
In parallel, the paper desks have been closely watching the onset of demand destruction on localized level, where higher spot gold/silver prices printed at the start of this year are believed to have caused the 19% YoY reduction in silver usage intensity for the photovoltaic solar industry and is projected to result in the largest reduction in annual usage since silver started to be used in solar to just 151 million ounces this year.
The silver thrift and substitution has dampened physical industrial demand for the near term while providing macro bears with a short-term window to dump the market, as structural demand from data centers for AI development, electrical grids, automobiles, etc., continues to build.
Technical Analysis: 4H Chart Confirms Bearish Breakdown Beneath Descending Triangle Base
The macro fundamentals can be completely ignored for a second and let’s turn our attention to the 4H chart, where spot silver just posted a nice clean continuation breakdown.
XAG/USD broke below the descending triangle floor with a nice solid breakdown to its current price of $57.53. The pair continues to stay below the resistance line of a correction, as it is also well below its trailing 200-EMA on the 4H timeframe of $65.89.
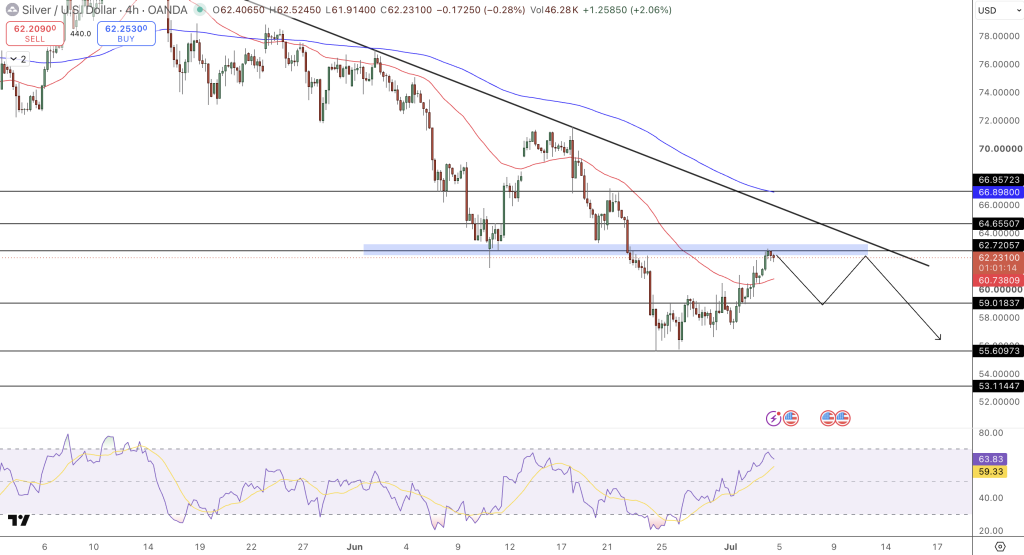
The RSI is currently reading at a weak 41.91 level, indicating that selling power is still in control, as it could go another step lower before reading oversold and MACD is below the zero level on the 4H chart with expanding bars, which indicates further bearish continuation. The pair has found its first low at $55.61 with potential targets at $53.11 support.
Conclusion and Trade Idea
Silver is currently re-pricing the underlying macro environment as the war premium fades and a new Federal Reserve under Chair Kevin Warsh provides the framework for elevated borrowing costs worldwide for the foreseeable future.
Despite the strong fundamental of a continuing 46.3 million ounce physical deficit, the continuation breakdown of the silver bull market below the descending triangle floor indicates continued selling pressure on rallies, as resistance is now located at the old support floor.
Tactical Continuation Blueprint
Look to short rallies back into the triangle resistance floor at $59.06, where the pair will need to reclaim this level for bulls to regain the floor. A short position is suggested with a stop loss on the top side of the recent swing high at $61.55, targeting further downside to $55.61 and with a secondary target below that at the old support floor located at $53.11.
Longer term downside targets are located at $50.70, which will provide a significant value zone for bulls to enter.
- Check out our free forex signals
- Follow the top economic events on FX Leaders economic calendar
- Trade better, discover more Forex Trading Strategies
- Open a FREE Trading Account
- Read our latest reviews on: Avatrade, Exness, HFM and XM
Related Articles


Sidebar rates
Related Posts
