IREN Stock Price Prediction: Is a 36% Correction Still on the Table?

Quick overview
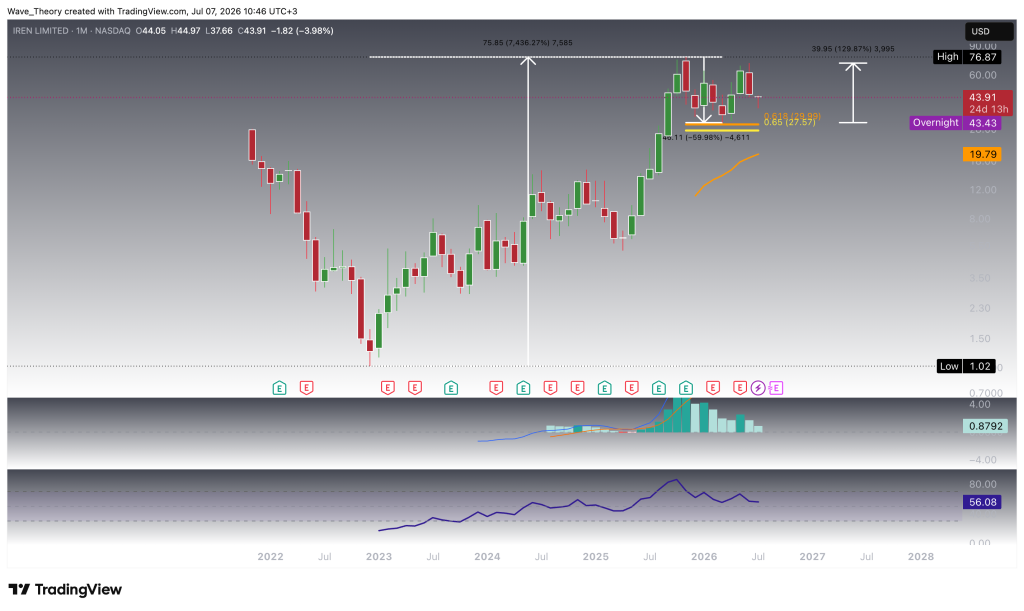
- IREN has experienced a remarkable rally of over 7,400% from its cycle low but is currently in a corrective phase, trading approximately 43% below its all-time high.
- The critical Golden Ratio Fibonacci support between $27.57 and $29.99 is essential for maintaining the long-term bullish trend, with a break below this level indicating a potential deeper correction.
- Despite weakening momentum indicators, the broader market structure remains constructive as long as IREN holds above the key support zone.
- Short-term indicators suggest bearish momentum, but there are signs of potential stabilization as the MACD histogram begins to tick higher.
IREN (NASDAQ: IREN) has entered a corrective phase after delivering one of the strongest rallies among AI infrastructure and Bitcoin mining stocks over the past several years. Following an extraordinary gain of more than 7,400% from its cycle low, the stock has pulled back sharply from its all-time high as investors take profits and momentum begins to cool.
Despite the recent weakness, the broader technical picture remains constructive. While momentum indicators across the weekly and daily timeframes continue to deteriorate, the long-term trend remains bullish as long as IREN holds above its critical Golden Ratio Fibonacci support between $27.57 and $29.99. Investors are now watching whether buyers can defend this key support zone or whether the correction will extend further in the coming weeks.
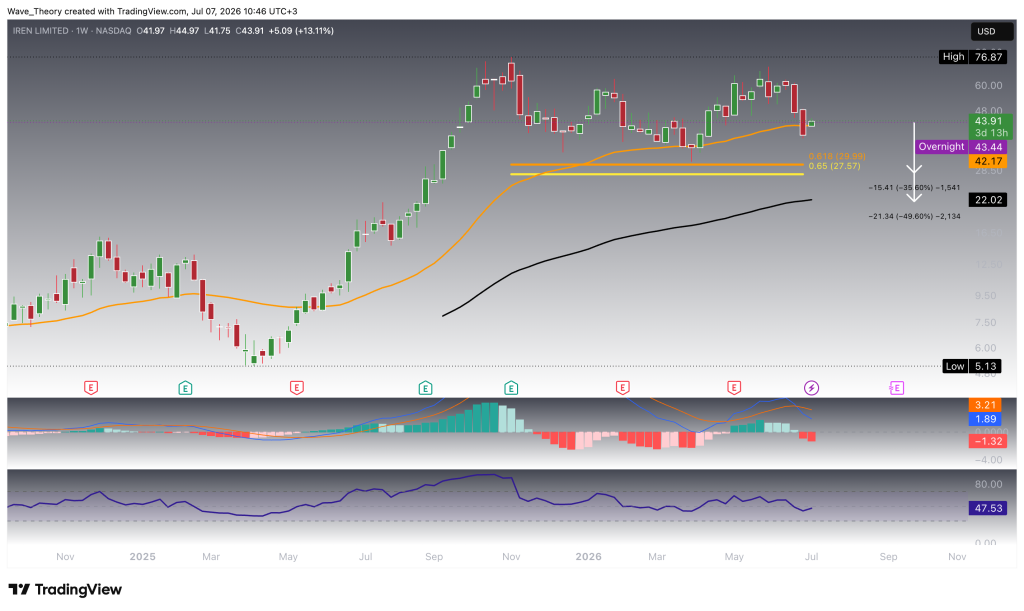
Weekly Chart Shows Correction Toward Major Fibonacci Support
On the weekly chart, IREN remains under pressure after failing to hold its recent highs near $70. The stock is now approaching its most important Golden Ratio Fibonacci support zone between $27.57 and $29.99. A decline toward this support would imply approximately 36% downside from current levels, while a move toward the 200-week EMA around $22 would represent a correction of roughly 50%.
Momentum indicators have weakened noticeably. The MACD lines have completed a bearish crossover, while the MACD histogram continues ticking lower, confirming increasing downside momentum. Meanwhile, the RSI remains in neutral territory around 48, providing neither bullish nor bearish signals.
Despite the ongoing correction, the broader market structure remains constructive as long as the Golden Ratio support between $27.57 and $29.99 continues to hold. Moreover, the EMAs continue to display a golden crossover, which confirms the trend bullishly in the mid-term.
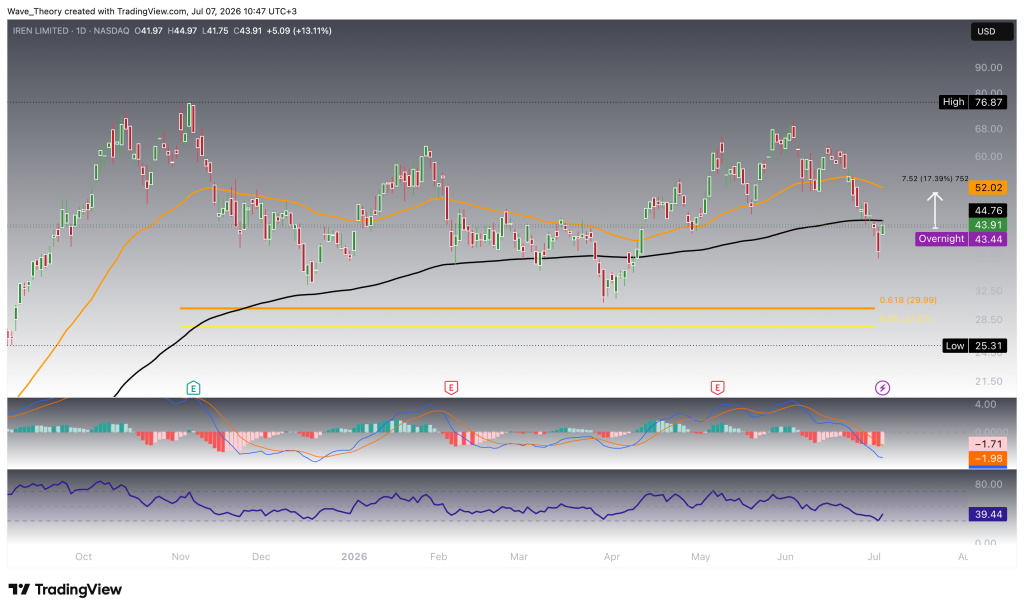
Daily Indicators Continue to Favor the Bears
On the daily chart, IREN remains in a clear short-term correction after losing both the 50-day EMA and the 200-day EMA. The recent bounce has pushed the stock back toward the 200-day EMA, which now acts as immediate dynamic resistance around $44.76.
Momentum indicators continue to favor the bears. The MACD lines remain bearishly crossed, although the MACD histogram starts to print higher values, signaling a potential reversal in the short-term. At the same time, the RSI has fallen toward 39, approaching oversold territory without yet generating a bullish reversal signal.
Should the correction continue, the next major support remains the Golden Ratio Fibonacci zone between $27.57 and $29.99. Conversely, reclaiming the 200-day EMA would represent the first technical signal that bullish momentum is beginning to recover. Then, the next significant resistance lies at the 50-day-EMA at $52, implying upside of roughly 17.4%.
Moreover, the EMAs display a golden crossover, which confirms the trend bullishly in the short- to medium term.
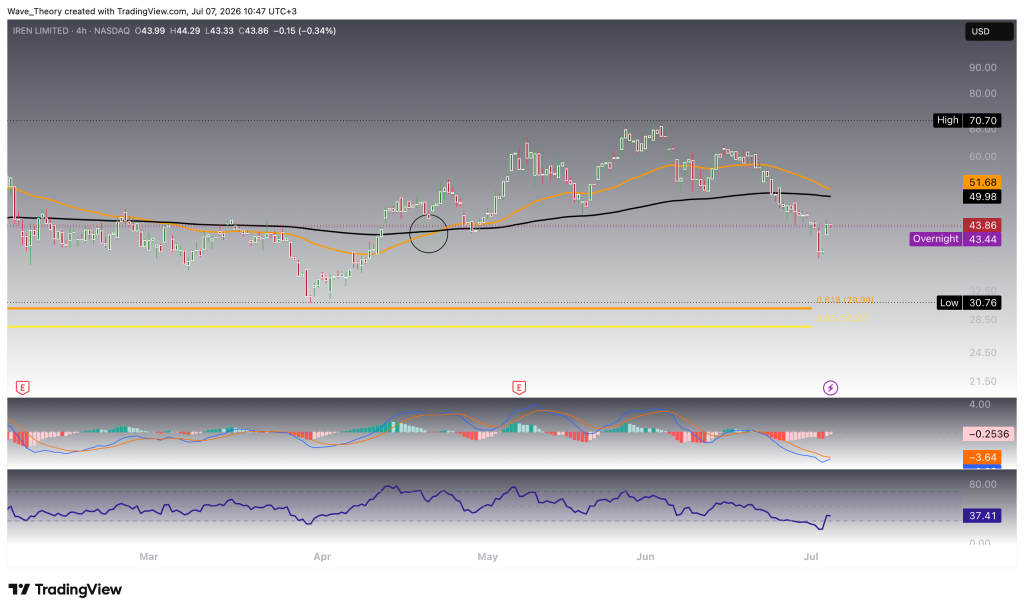
4-Hour Chart Suggests Short-Term Stabilization
On the 4-hour chart, IREN has attempted to stabilize following its sharp decline. After briefly falling below recent lows, buyers managed to push the stock back toward the 200-period EMA, which currently serves as immediate resistance around $49.98. The 50-4H EMA remains overhead near $51.68, reinforcing this resistance zone.
The MACD lines could bullishly cross, as the MACD histogram has started ticking higher. In contrast to that, the EMAs could potentially form a death cross, which would confirm the trend bearishly in the short-term.
The MACD suggests that bearish momentum is beginning to weaken despite the prevailing downtrend. Meanwhile, the RSI has rebounded from oversold territory but remains below 40, indicating that short-term momentum still favors the bears.
As long as IREN trades below both the 50-EMA and 200-EMA on the 4-hour chart, the short-term trend remains bearish. If sellers regain control, the next major downside target remains the Golden Ratio support between $27.57 and $29.99. Conversely, a sustained break above both moving averages would significantly improve the short-term technical outlook.
IREN Stock Price Prediction: Summary
IREN remains in a long-term bullish market structure despite correcting significantly from its all-time high. The stock has already declined more than 43%, while momentum indicators across the weekly and daily charts continue to weaken. The next major downside target sits at the Golden Ratio Fibonacci support between $27.57 and $29.99, representing the most important level for the long-term trend.
On the shorter timeframes, bearish momentum has started to ease as the 4-hour MACD histogram turns higher. However, IREN continues to trade below its key moving averages, keeping the short-term outlook bearish. As long as the stock remains above the Golden Ratio support, the broader uptrend stays intact. A decisive break below this zone would significantly weaken the technical outlook and increase the probability of a much deeper correction.
- Check out our free forex signals
- Follow the top economic events on FX Leaders economic calendar
- Trade better, discover more Forex Trading Strategies
- Open a FREE Trading Account
- Read our latest reviews on: Avatrade, Exness, HFM and XM

Related Articles

Sidebar rates

Related Posts
 Save
SaveAva

