Why Is Apple (AAPL) Stock Down Today? Services Miss Sparks Post-Earnings Selloff
Apple stock falls after Q3 earnings despite record $109.4B revenue and $2.02 EPS, as a Services miss and supply concerns weigh on AAPL.
Quick overview
- Apple reported record June-quarter revenue of $109.4 billion and an EPS of $2.02, but shares declined due to a miss on Services revenue and concerns over future supply issues.
- Despite a 22% year-over-year increase in iPhone revenue, investors were dissatisfied with the Services revenue of $30.7 billion, which fell short of analyst expectations.
- Apple's gross margin guidance for the upcoming quarter is lower than previous results, attributed to reduced tariff benefits and ongoing supply constraints.
- The stock is currently facing selling pressure, with key support and resistance levels identified at $312 and $320, respectively.
After reporting a record June-quarter revenue of $109.4 billion, with an EPS of $2.02, AAPL (NASDAQ) shares lost value in the aftermath of the company’s fiscal Q3 2026 earnings call. The stock hit an all-time high in the days prior to the report, and the losses were attributed to a miss on Services revenue, management’s comments on future supply issues for iPhone, Macs, and iPads, and profits being taken.
According to Reuters, Apple shares declined after the company exceeded expectations with their headline earnings report, and investors doubted the hardware (iPhone) momentum was enough to counter a slowdown in Services revenue.
Apple reported one of their best June quarters, this time driven by a 22% year-over-year increase in iPhone revenue and an overall revenue increase of 16%. However, investors were not satisfied. Services revenue increased to $30.7 billion, and was less than analyst expectations, supply issues were communicated for the September quarter and gross margins were reported to be lower with the end of tariff-related benefits. Concerns over the report caused widespread profit taking.
Record Earnings Overshadowed by Services Miss
Apple Revenue of $109.4 billion, a Year over Year increase of 16%, and a diluted EPS of $2.02, an increase of 29% Year over Year, were all reported to be Better than Expected.
Investors, however, were not satisfied and reported a Services Miss. Services revenue, of $30.7 billion, increased Year over Year, but was below analyst expectations. Since Services Revenue is a higher-margin, and key, Segment of Apple’s Business, a Services miss, however small, is a negative for Apple with investors.
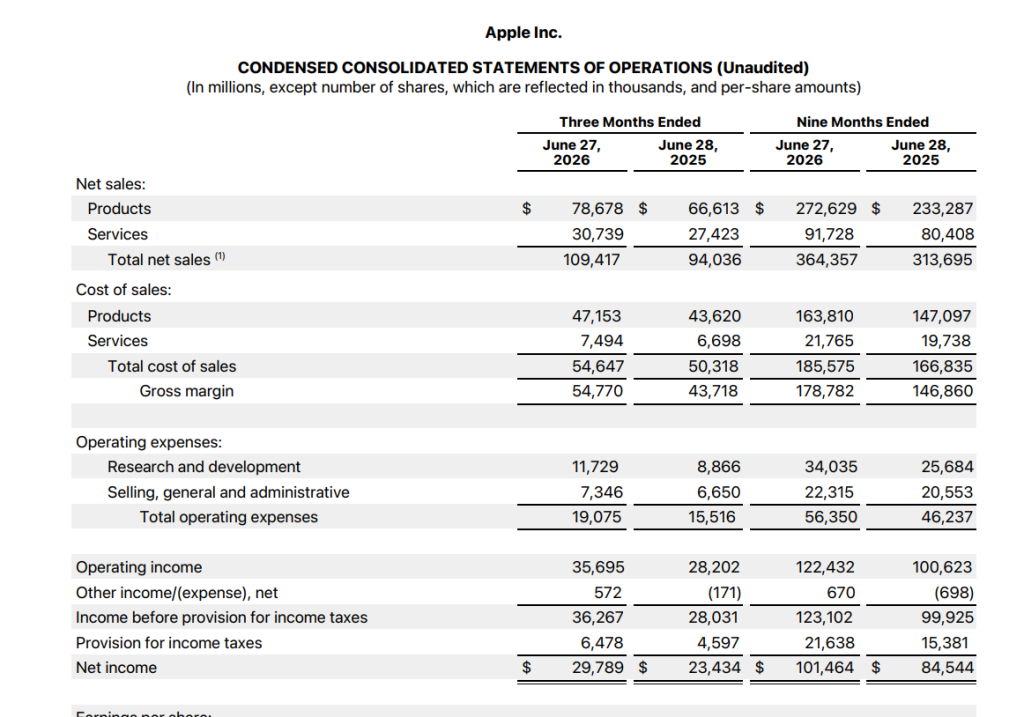
Apple Q3 FY2026 Results. Full Report (PDF): https://www.apple.com/newsroom/pdfs/fy2026q3/FY26_Q3_Consolidated_Financial_Statements.pdf
Overall, Apple guided September quarter revenues to increase by 9% to 11% year-on-year, while taking a more cautious view, stating that foreign exchange headwinds and supply constraints on iPhones, Macs and iPads were likely to remain this quarter. Apple said gross margins were likely to be in the range of 47% to 48% compared to 50.1% in June, due to a further concession of tariff refunds.
iPhones and Macs are Revenue Growth Drivers
Despite the negative market perception, Apple continues to show solid growth and strong fundamentals. Quarterly iPhone revenues rose by 22% year-on-year to $54.3 billion, while Macs and Services revenues increased by 29% to $10.4 billion and by 12% to a record all-time high, respectively.
As iPhones and Macs continue to grow in popularity, the number of active Apple devices continues to grow. Apple continues to return capital with dividends and share buybacks.
Profitability Boosted by Tariff Refunds
Reported profitability increased by an estimated 2% of gross margin from tariff refunds. Apple said the operating outlook remained healthy, but management’s gross margin guidance for the quarter was below June’s results, as a result of a lower contribution from tariff refunds in future quarters, which will drive earnings growth, as demand for hardware and Services, along with AI-related upgrades, grow.
Apple has broken below the $312 support level and has been under increased selling pressure in the weeks after the earnings report. This has completely erased the breakout from July. Currently, Apple is below the 100-period EMA at $320, and the $312 – $320 support zone has been tested and is now major resistance.
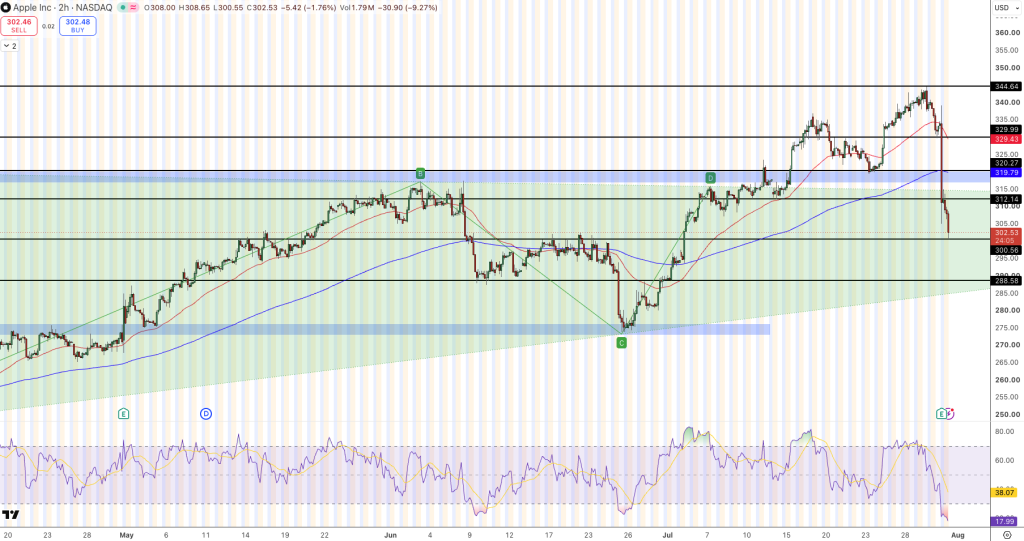
Momentum is lagging significantly with an RSi at 20. This is very oversold and does invoke the potential for a short-term bounce, however, Apple is in a predominantly bearish position until buyers come back and enter the old support zone.
If $312 is broken, a potential target of $320 would be the next level which is closely followed by $329.43. If $300.56 is broken, a further target of $288.58 is likely with $275 potential support at the long-term trend.
312.14, 319.79, 329.43 = Resistance
300.56, 288.58, 275.00 = Support
Trade Setup
Entry: Buy only after support at $312.14 holds
Targets: $319.79, $329.43
Stop Loss: $300.56
As long as price remains below $312, sellers are in control, and any price rally will be sold. The first strong indication that buyers have come back will be if Apple reclaims the $312 level.
Frequently Asked Questions
What is the reason for the drop in Apple Stock post earnings release?
Although Apple had a good earnings report, the market was more concerned about the Services revenue report, supply issues, declining gross margin guidance, and the diminishing effects of tariffs. Revenue was unparalleled, and though good earnings were reported, profit taking was triggered per our sources at Reuters.
What was the outcome of Apple earnings regards to good or bad earnings report?
Good report. Reported revenue was $109.4 billion with a reported EPS of $2.02, and revenue of iPhones reported an increase of 22%.
What are the price points for Apple to watch?
Expected resistance is at $312.14, $319.79, and $329.43. Expected support is at $300.56, $288.58, and $275.00.
- Check out our free forex signals
- Follow the top economic events on FX Leaders economic calendar
- Trade better, discover more Forex Trading Strategies
- Open a FREE Trading Account
- Read our latest reviews on: Avatrade, Exness, HFM and XM

Related Articles

Sidebar rates

Related Posts
 Save
SaveAva