What is the Stochastic Indicator And How to Use it for Forex Trading?
In technical analysis, there are dozens of different indicators and strategies to optimize your trading activities. While there are many advanced indicators like the Relative Strength Index (RSI) or Moving Average Convergence Divergence (MACD) which go far beyond the basics of support and resistance levels, there are even further optimizations of such indicators which can benefit your trading style.
One of those is the stochastic indicator, which will be introduced in this piece.
What is a Stochastic Indicator?
A stochastic oscillator is very similar to the RSI, a popular technical indicator for revealing overbought and oversold regions. Since its introduction in the 1950s, it still is among the most popular trading indicators to this day. Both the RSI and the stochastic indicator are based on the momentum of the price rather than the absolute price. Hence, the relative strength index (RSI) and the stochastic oscillator are both widely used in technical analysis for indicating short-term turning points and are often combined, despite the fact they each have different underlying formulas. The stochastic oscillator is built on the assumption that closing prices should close near the same price as the current trend’s direction. Meanwhile, the RSI only indicates overbought and oversold regions by measuring the speed of the price movements. To put it differently, the RSI measures the speed of price movements to indicate turning points, while the stochastic indicator does the same but emphasizes most recent price movements more. Therefore, the stochastic oscillator is a more sensitive indicator.
Generally speaking, the RSI is more precise during trending markets, while the stochastic more so in sideways markets.
How to Read the Stochastic Indicator
The stochastic oscillator ranges between the values 0 and 100. Values above 80 are considered overbought regions while reaching below 20 are considered oversold levels.
However, the stochastic oscillator’s lines going above or below those levels do not always indicate a trend reversal. If the trend is strong enough, it can maintain in overbought or oversold regions for an extended period. If that’s the case, bullish and bearish divergences are often formed and more often than not, those divergences result in a heavy (short-term) trend reversal.
Relying only on the overbought and oversold regions can give traders false signals, resulting in negative trades. Instead, traders should look for a confluence of different indicators, meaning multiple indicators that point in the same direction.
Furthermore, the stochastic oscillator consists of two lines; a blue and a red one by default settings. One of them displays the actual value of the oscillator for each session, and one shows its three-day simple moving average. Based on the assumption that the price is thought to follow momentum, a crossover of these two lines is considered to be a signal that a reversal may follow in the not-too-distant future, as it indicates a large shift in momentum between two days.
Divergence, as mentioned before, is also seen as an important reversal signal. For instance, when a bearish price trend forms a lower low, but the oscillator shows a higher low, it may hint towards a bullish trend reversal as the bears are losing momentum.
RSI, Stochastic indicator and Stochastic RSI
The stochastic RSI is built by applying the stochastic oscillator formula to a set of relative strength index (RSI) values rather than to standard price data. The StochRSI oscillator was developed to make use of both momentum indicators in order to create a more sensitive indicator that is adjusted to a specific security’s historical performance rather than a generalized analysis of price change. That said, one isn’t superior to the other, the StochRSI just moves more and faster than the RSI.
Comparing RSI, Stochastic indicator and Stochastic RSI
USD/EUR DAILY CHART
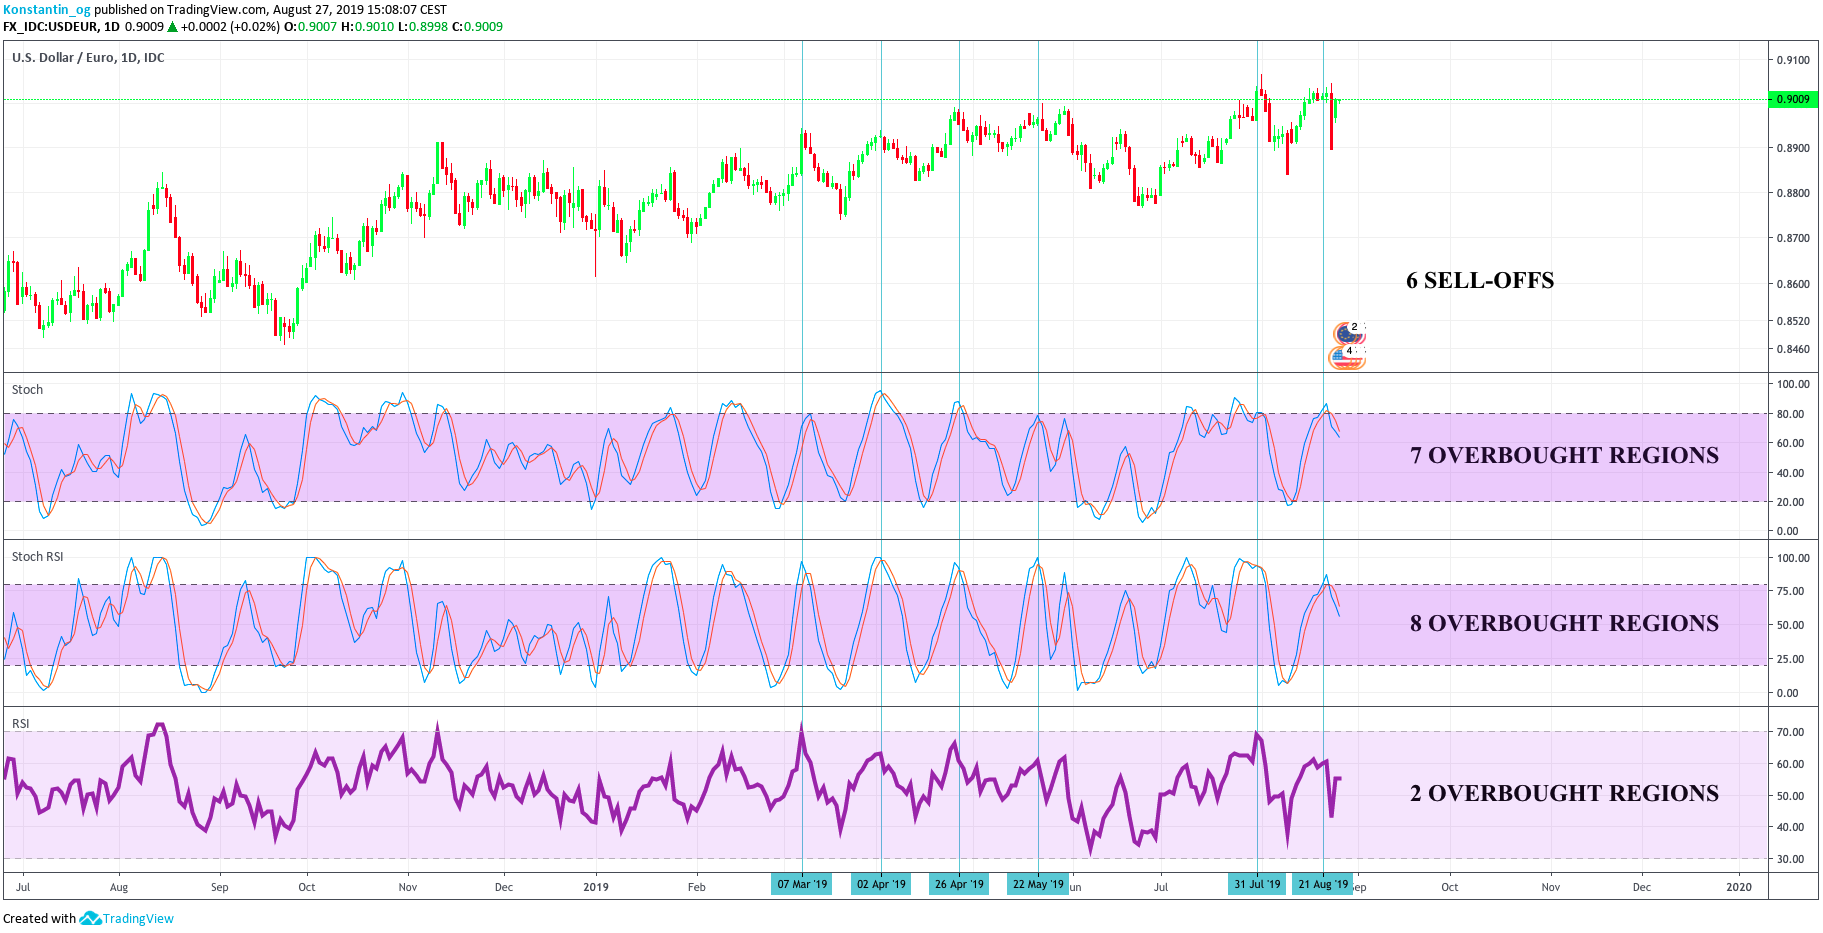
When comparing the RSI, the stochastic RSI, and the stochastic indicator, we can observe that in a time-span of almost six-months, there have been six significant sell-offs. During that period, the stochastic indicator touched overbought regions seven times, while the stochastic RSI touched it eight times. In contrast, the RSI only touched it two times. The total volatility of the USD/EUR currency pair during that time span was 3.75 percent, which is very low compared to high-risk asset classes. Thus, we can conclude that the stochastic indicator works better in forex than the RSI; however, it gave one false overbought signal during that period.
Example of a Bullish Divergence
USD/EUR DAILY CHART
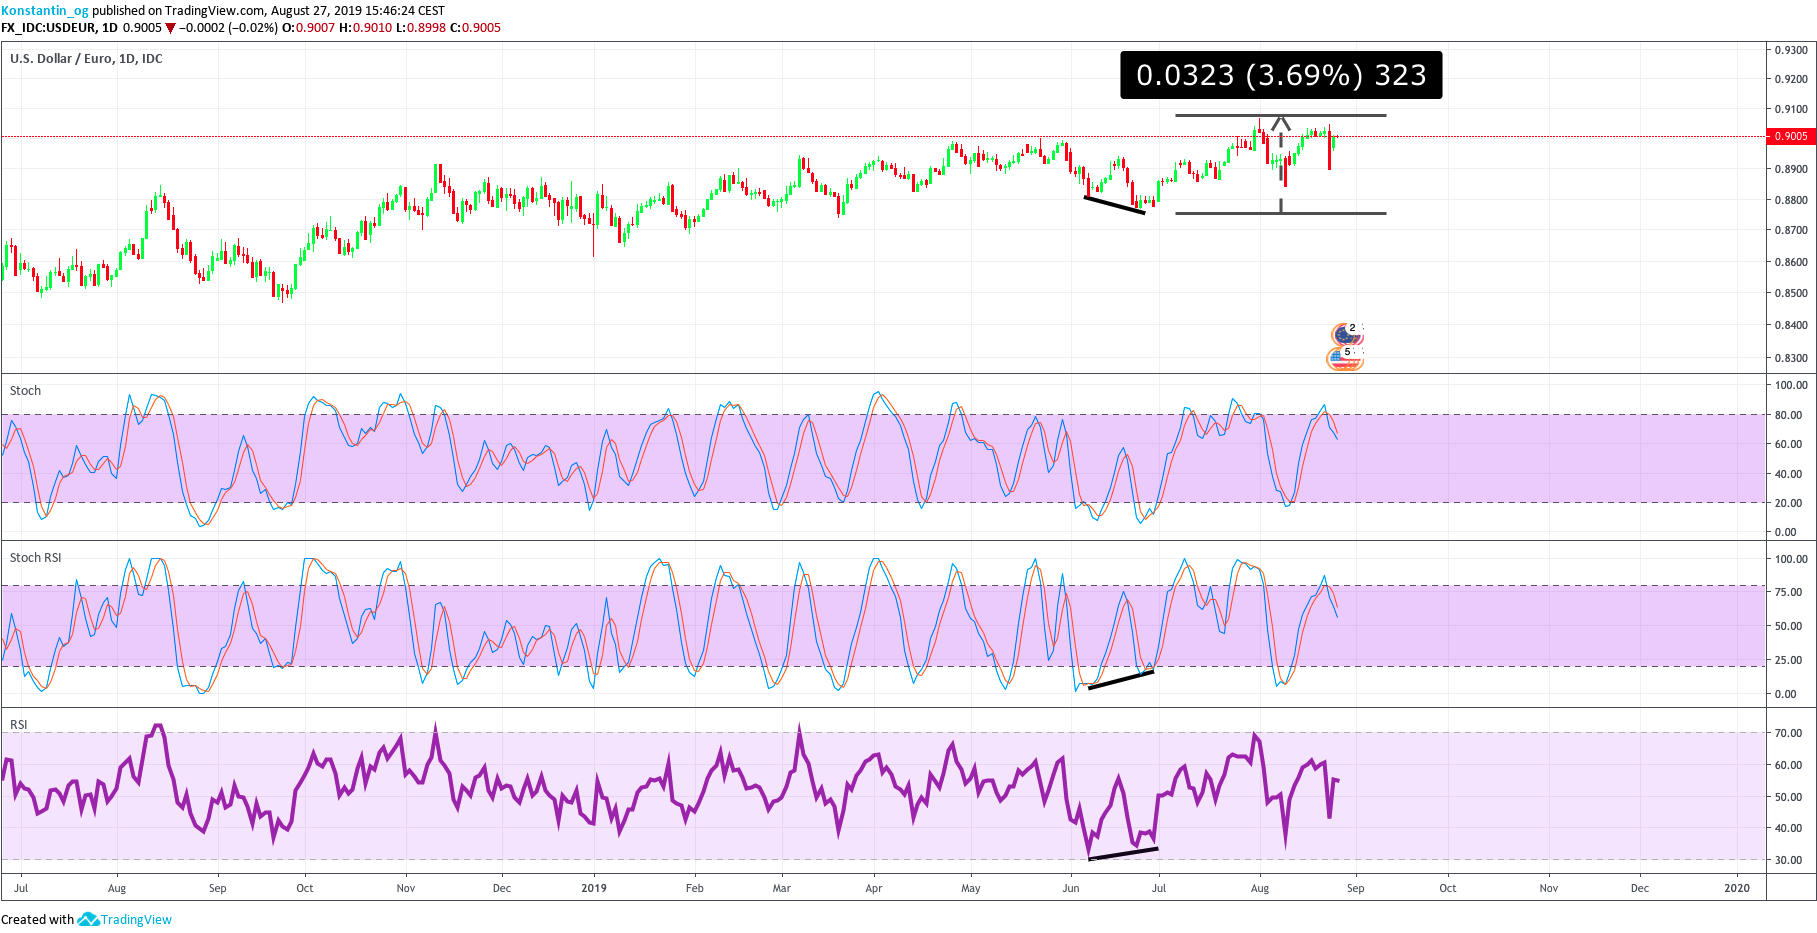
In the example above, you can see that the USD/EUR currency pair was making a lower low while the StochRSI and the RSI formed a higher low. This divergence was followed by a steep increase of 3.69 percent, which is tremendous, taking into account that 3.75 percent was the maximum volatility of the entire time-span of six months.
Sidebar rates
