Has The Trend Changed In NZD/USD?
After being short on AUD/USD for a long time, we decided to shift our attention to NZD/USD shorts. The bigger picture changed when the RBNZ (Royal Bank of New Zealand) decided to remain dovish, unlike the market's expectations.
By the end of the week though, the Commodity Dollars started putting up a fight. They started a retrace and ended up about 100 pips higher compared to the USD yesterday.
 The 100 SMA is providing support
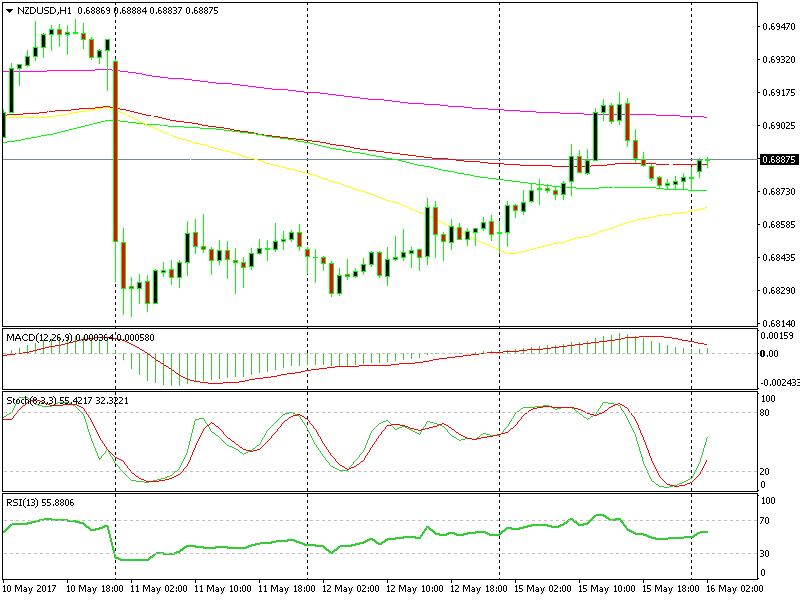
NZD/USD reached the 200 SMA on the hourly chart. In the afternoon it retraced back down on the hourly chart, as you can see above. The problem for our short NZD/USD trades that we planned is that the price is turning back higher now.
If the downtrend is to continue, the price must break the 100 SMA (green) which is providing support and make a new low. However, that´s the narrow view that we get from the hourly forex chart.
If we switch to the H4 chart, we can see that the same moving average (100 SMA) here, which has provided strong resistance over the last two weeks, is still in play. Yesterday it rejected the price.
The downtrend is still in play on the H4 chart
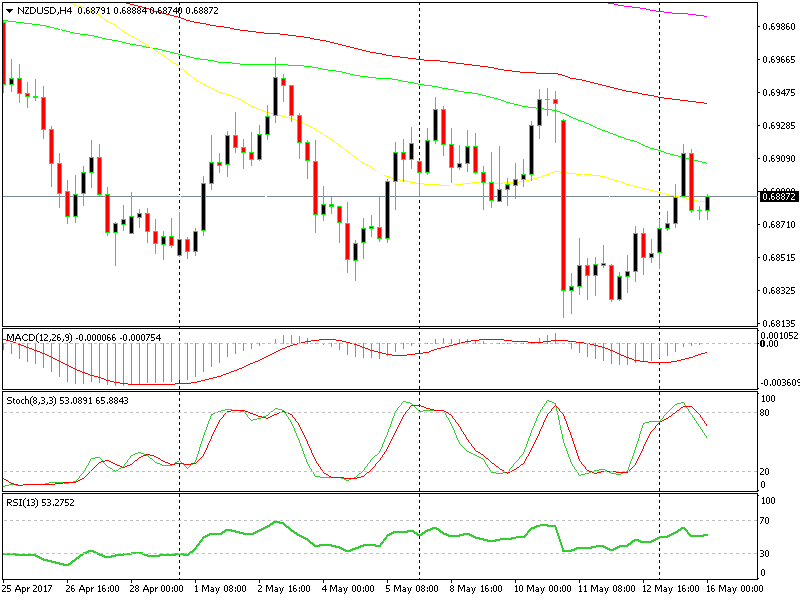
So, according to the larger chart, the downtrend is still in play, therefore we remain bearish on this forex pair. We should have opened a long term sell forex signal at the 100 SMA, but at least we had a successful short term signal up there and intend to open more if the downtrend progresses.
- Check out our free forex signals
- Follow the top economic events on FX Leaders economic calendar
- Trade better, discover more Forex Trading Strategies
- Open a FREE Trading Account
- Read our latest reviews on: Avatrade, Exness, HFM and XM
Related Articles

Sidebar rates
Related Posts
