Trade Plan for WTI Crude Oil – EIA Inventories coming out!
During the US session today, we may encounter some volatility in the WTI Crude Oil on the back of EIA stockpiles report. Let's take a quick look at the Forex trading signal idea.
American Petroleum Institute Report
As per the American Petroleum Institute, the U.S. crude stocks dropped by 9.2 million barrels in the week 469.2 million. The drop is lower than the forecast of 3.1 million barrel drop, thus helped boost the Crude Oil prices during the early Asian session today. Now, investors are awaiting EIA Crude Oil Inventories which are scheduled to Stochastics at 14:30 (GMT) with a forecast of -3.3million draw.
Technical View
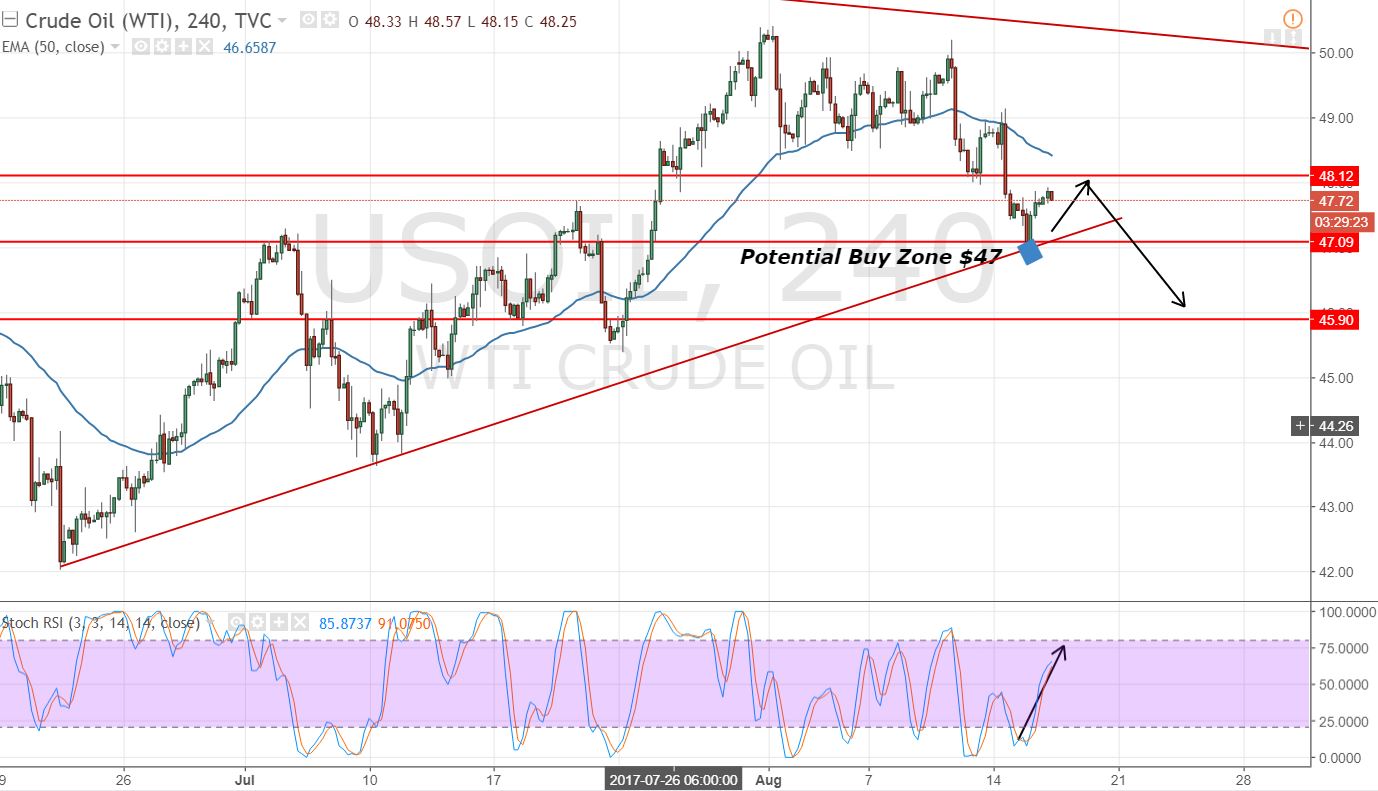
On the 4- hour timeframe, Crude Oil is consolidating in a narrow trading range of $47 – $48, yup that's it. All we need is to wait for the breakout. Perhaps it's quite possible in the U.S. session today on the release of inventory figures.
 Crude Oil – 4 Hours Chart – Bullish Trendline ?
We can also see a bullish trend line, supporting the Oil at $47. The break below this is likely to push the oil deeper to $46.65 and $45.95. The 50- periods EMA is resisting at $48.35, signaling the bearish sentiment of traders. But the Stochastics is holding in a buying zone (above 50). In short, we need to see EIA inventories figure before taking any position.
WTI Crude Oil Trading Plan
The idea is to stay in buying only above $47.30 and $47 to target $48. On the flip side, sell is recommended below $48.40. Good luck!


