Oct. 2 – Bearish Gold – Reversal or Retracement?
What’s up traders, we made it through another profitable month. Let's welcome October and get ready to catch some nice profits. The USD i
What’s up traders, we made it through another profitable month. Let's welcome October and get ready to catch some nice profits. The USD is playing defensive after falling to a multi-month low and causing selling pressure on the Gold. Yes, this was anticipated, that's why we entered a sell signal early on Friday.
On the fundamentals side, the current is really significant from the trading point of view as we have Fed Chair Janet Yellen speaking and the ADP Non-Farm Employment Change, ISM Non-Manufacturing PMI and Labor Market figures on the docket.
Technical View of Gold
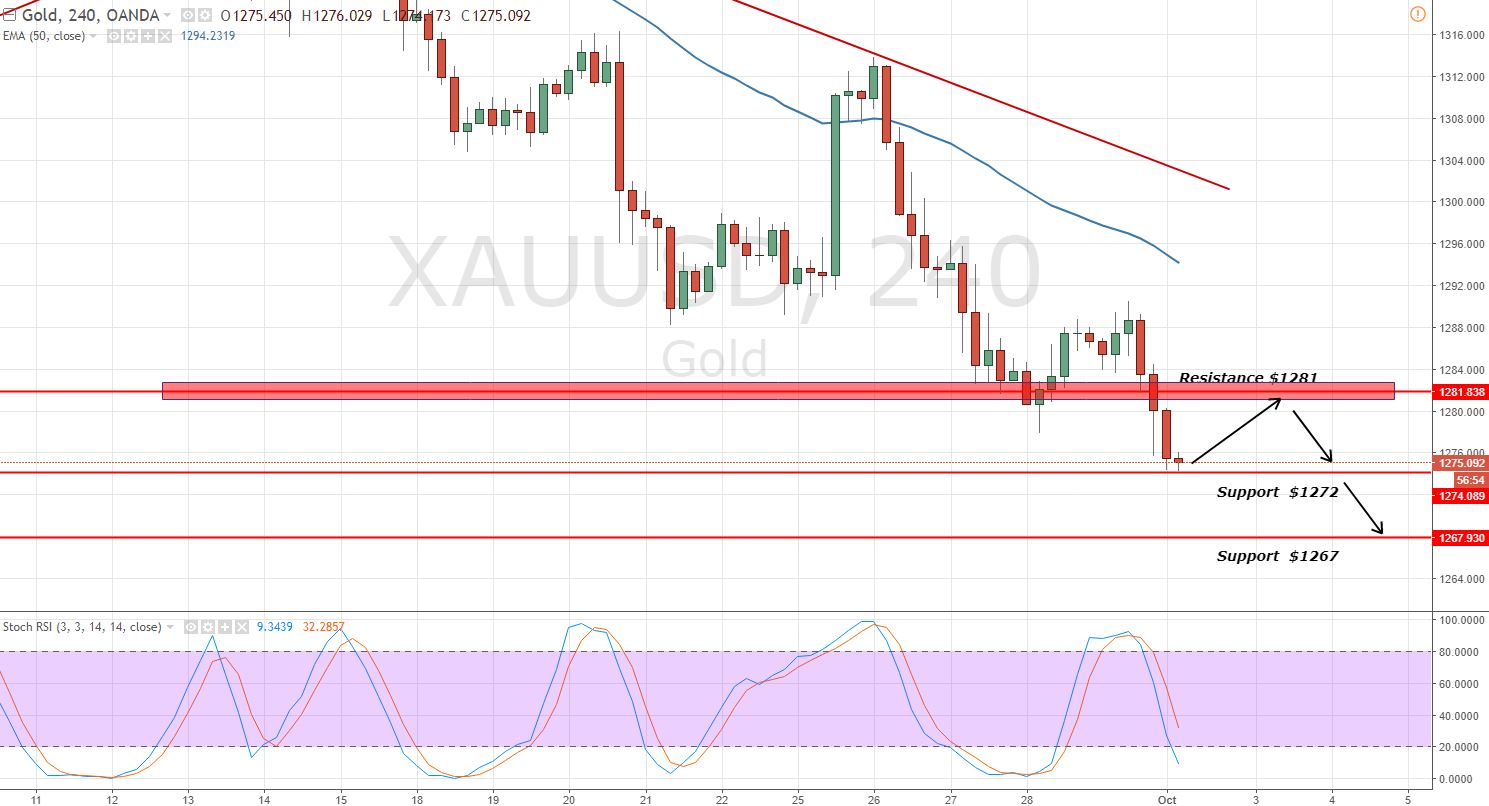
The technical outlook is quite clear. On the 4-hours chart, gold prices are still consolidating below 50 periods moving averages at $1,300 along with momentum indicators below 50. This signifies a neutral bias of investors.
 Gold – 4- Hour Chart – Support Area
 Gold – 4- Hour Chart – Support Area
Zooming out to the hourly chart, the metal has to complete 23.6% Fibonacci retracement at $1,278, and it may go for $1,280, the 38.6% retracement. Don't know about Fibonacci? No worries, check out FX Leaders Fibonacci trading strategy to avoid the trap in wrong trades.
Gold Trading Plan
The trade plan is simple. I'm gonna take a buy position above $1,275 and another buy above $1,271 with a stop below $1,267 in order to target $1,278 and $1,280. Good luck guys and trade carefully!
- Check out our free forex signals
- Follow the top economic events on FX Leaders economic calendar
- Trade better, discover more Forex Trading Strategies
- Open a FREE Trading Account
- Read our latest reviews on: Avatrade, Exness, HFM and XM
Related Articles


Sidebar rates
Related Posts
