Oil Faces A Tough Challenge Above! Time for a Decent Pullback?
Oil prices have been climbing pretty fast in the last few weeks. That has come after Oil has been trading in an uptrend for about six month
Oil prices have been climbing pretty fast in the last few weeks. That has come after Oil has been trading in an uptrend for about six months.
But technically, Oil faces a tough challenge on the top side. As you can see from the weekly Oil chart below, Oil has been finding support at the 100 simple MA (green) earlier this year. It has kept the price from sliding lower several times, which has discouraged the sellers and encouraged the buyers.
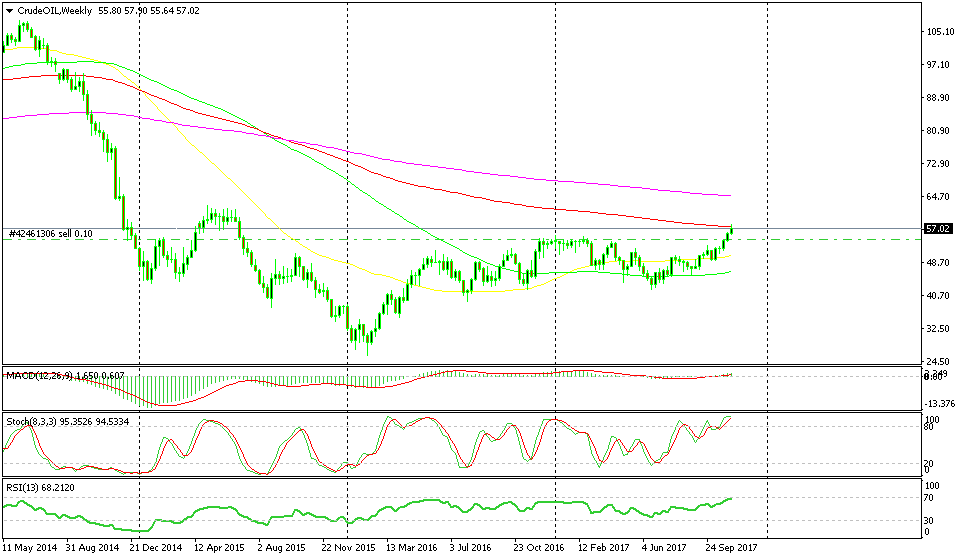
The 100 smooth MA is the line in the sand for Oil traders now.
Since summer, it has been a one-way road for Oil. But now, the price has reached the 100 smooth moving average (red) on the weekly chart. It peaked above it earlier this week, but that doesn’t count as a proper break according to moving average strategies.
The weekly candlestick has to close above it for this to count as a break. If today closes below $57.50, then we can say that this moving average is acting as resistance.
If that’s the case, then I suppose we will see a reversal. Probably, it won’t dive to the lows around $26 which we saw it fall two years ago, but a decent retrace lower is possible. The weekly and the monthly charts are oversold, so a retrace lower is overdue.
- Check out our free forex signals
- Follow the top economic events on FX Leaders economic calendar
- Trade better, discover more Forex Trading Strategies
- Open a FREE Trading Account
- Read our latest reviews on: Avatrade, Exness, HFM and XM
Related Articles


Sidebar rates
Related Posts
