EUR/USD Is Stuck Between Two Moving Averages
The price action of the US Dollar in the last couple of weeks, has pointed down on EUR/USD and in other forex majors. The Euro hasn’t been..
The price action of the US Dollar in the last couple of weeks, has pointed down on EUR/USD and in other forex majors. The Euro hasn’t been able to make new highs during this time and the Buck is slowly pushing this pair lower.
So, it seems like the USD Dollar might have started the big reverse everyone is waiting for. Although, these big reversal take some time usually; they don’t happen overnight.
There’s a range we can use between these two moving averages
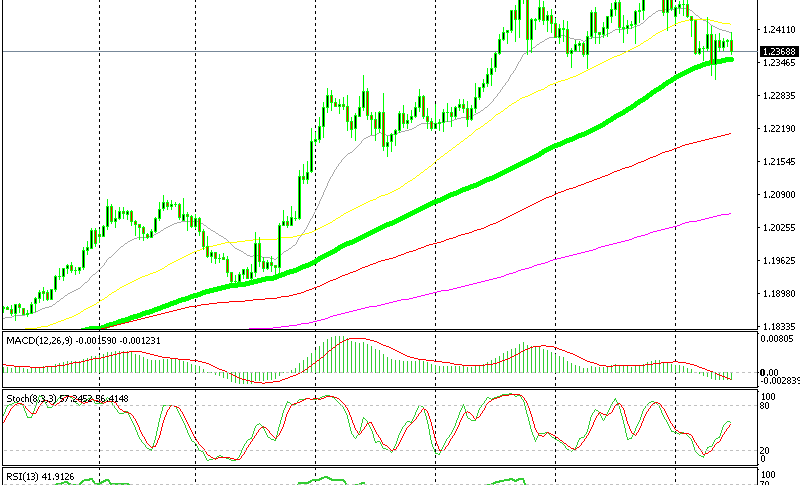
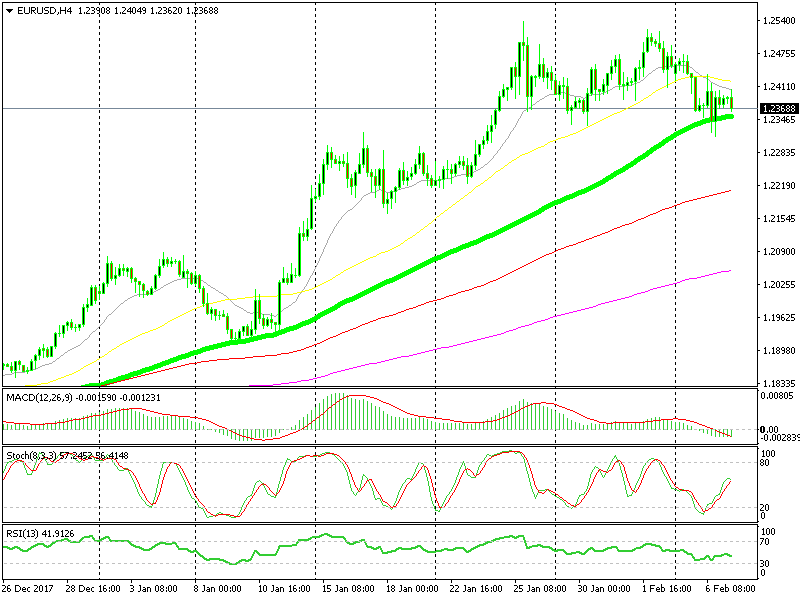
EUR/USD has moved lower in the last several days, albeit slowly. Although, yesterday, the price moved below the 50 SMA (yellow) on the H4 chart. This is one of the major signs that this forex pair might be shifting the trend.
The 50 SMA has been keeping the uptrend in place in the last two months or so. Now that it has been broken, the sellers don’t look that confident anymore.
Although, the 100 SMA (green) is being stubborn. If this moving average gets broken, then the odds of a trend reversal will go through the roof.
So, EUR/USD is stuck between the 50 SMA on top and the 100 SMA at the bottom on the H4 chart. We can play these two moving averages, meaning we can sell at the 50 SMA and buy at the 100 SMA, until one of them lets go. It’s like trading a range. You can target the opposite moving average and place the stop above/below the one you are buying/selling at.
- Check out our free forex signals
- Follow the top economic events on FX Leaders economic calendar
- Trade better, discover more Forex Trading Strategies
- Open a FREE Trading Account
- Read our latest reviews on: Avatrade, Exness, HFM and XM
Related Articles


Sidebar rates
Related Posts
