The Reversal Takes Shape in Bitcoin
Earlier today I spoke about a possible reversal in cryptocurrencies. Bitcoin had bounced from the 200 SMA on the daily chart and ...
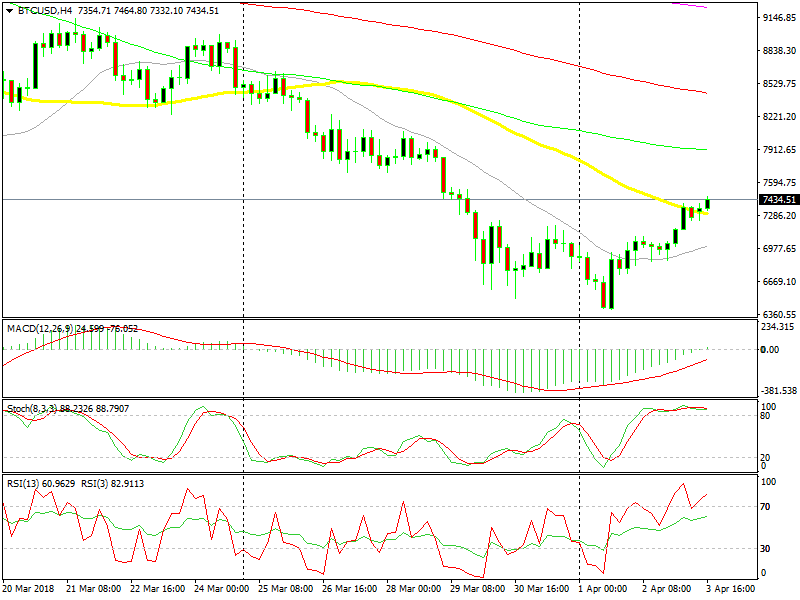
Earlier today I spoke about a possible reversal in cryptocurrencies. Bitcoin had bounced from the 200 SMA on the daily chart and the 50 SMA on the weekly chart. It had broken above the 20 SMA (grey) on the H4 chart, which had pushed Bitcoin lower last week. Last week this moving was acting as resistance and today the price moved above it.
So, it seemed like the trend was beginning to change. But the 50 SMA (yellow) was making life difficult for the buyers. It was providing resistance for many hours, so I thought that the buyers might as well give up if they wouldn’t be able to break above it soon.
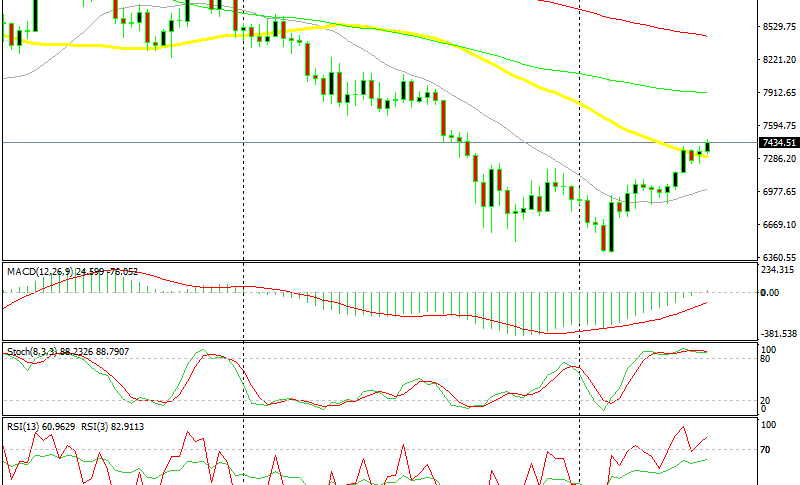
The 50 SMA might turn into support now
But, as you can see from the chart above, the buyers managed to push above the 50 moving average. Now that the price is above it, this moving average might turn into support. So, it might be a good place to look for an entry level for buyers. We are already long on Bitcoin, so we’re not buying anymore.
The H4 chart is overbought as the stochastic indicator suggests. So, we might see a retrace lower soon. But there daily and weekly charts are still oversold because the major pullback has started. I think this pullback will likely continue for a few days.
- Check out our free forex signals
- Follow the top economic events on FX Leaders economic calendar
- Trade better, discover more Forex Trading Strategies
- Open a FREE Trading Account
- Read our latest reviews on: Avatrade, Exness, HFM and XM
Related Articles


Sidebar rates
Related Posts
