A Look at Monthly Gold Chart
Gold has been going down a slippery slope in recent weeks. In fact, June has been a terrible month for Gold. The USD index has been mostly..
Fundamentals
Not Related to the USD
Gold has been going down a slippery slope in recent weeks. In fact, June has been a terrible month for Gold. The USD index has been mostly trading sideways during this month, but Gold which trades against the USD has accelerated the decline.
This means that the bearish sentiment in Gold has nothing to do with the USD. The USD index increased considerably in April and May, but the fall in the price of Gold was pretty slow during those two months. While this month when the Buck has traded in a range, Gold has tumbled hard.
Not A Safe Haven Issue
Since the USD is not driving the Gold price around, it should be the fundamentals, right? We know that demand for safe-haven assets increase when the market sentiment is negative. The market sentiment has turned negative with all the tariffs that Donald Trump is imposing.
But, Gold hasn’t benefited from that. The safe-haven currencies such as the JPY and the CHF have received strong bids in recent weeks,, but Gold has declined instead. That leaves Gold out of the safe-haven asset group.
Technicals
The Monthly Gold Chart
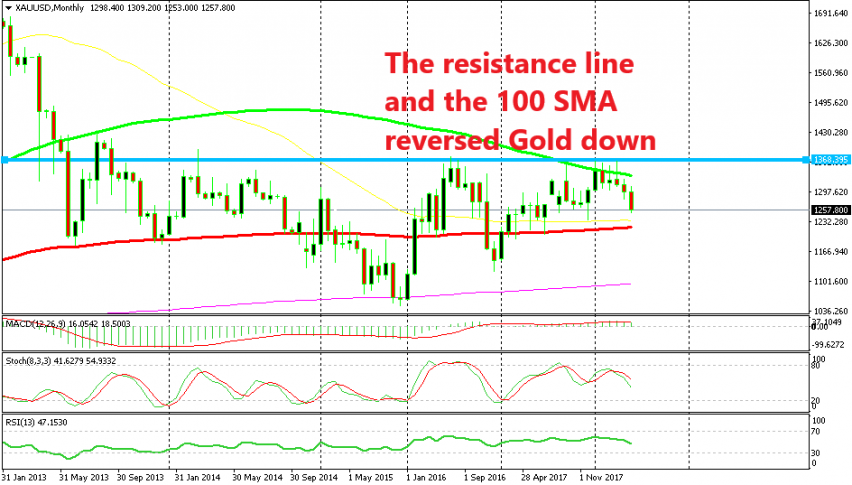
If none of the fundamentals are working for Gold then it should be a technical problem, right? Checking the monthly chart, I can see that Gold tried to break past the resistance for four months in a row. But, it failed to do so and the buyers got discouraged by that.
The resistance line held its ground and the 100 SMA (green) helped as well. This moving average has been providing resistance to Gold previously and together with the resistance level which stands at roughly $1,368. The stochastic indicator was overbought and a bearish reversal made sense from up there.
It didn’t take long for the sellers to regroup and since then we have seen Gold accelerate the decline. The target now is the 100 smooth MA (red). That moving average has been providing support for years so that is the main target, which is around $40 away from the current price.
- Check out our free forex signals
- Follow the top economic events on FX Leaders economic calendar
- Trade better, discover more Forex Trading Strategies
- Open a FREE Trading Account
- Read our latest reviews on: Avatrade, Exness, HFM and XM
Related Articles


Sidebar rates
Related Posts
