Daily Briefing, Apr 4 – How to trade EUR/USD on ECB Meeting Accounts?
European Central Bank will release the monetary policy meeting accounts. These minutes will present a comprehensive record of the March...
The cryptocurrencies kicked back to life with Bitcoin’s rush to nearly 5-month highs on Wednesday. The leading cryptocurrency jumped from roughly $4,000 to $5,080 in a 60-minute window early on Tuesday, and the bullish trend continues.
Gold prices edged up as the dollar softened and a rally in stock indices takes a breather. Investors are in a relaxed mode as focus shifts to US-China trade war and the US Nonfarm payroll figures later this week.
The Greenback is down around 0.1% against key opponents as the odds of a potential trade deal between the US-China is fading its safe-haven appeal.
What’s there for us today?
The fundamentals side of the market is a bit light today. The only crucial economic event is the ECB Monetary Policy Meeting Accounts.
ECB Monetary Policy Meeting Accounts
At 11:30 (GMT), the European Central Bank will release the monetary policy meeting accounts. These minutes will present a comprehensive record of the March policy meeting. The Euro is trading near its 2019 lows, although a more dovish Fed has been able to balance any of the dark Eurozone outlooks from pressing on the single currency.
The bank has lately asserted that it had no intentions to increase rates before 2020, and the Euro countered with losses. To those who have been paying attention to ECB monetary policy and economic events, the dovish meeting minutes won’t be a surprise.
Traders will be focusing on the expectations of members regarding economic growth for the Eurozone.
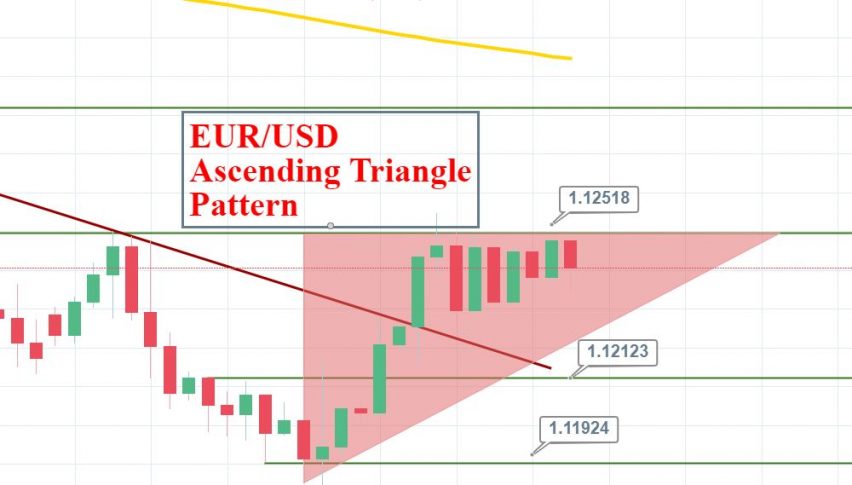
EUR/USD – Ascending Triangle Pattern
The single currency Euro gained bullish momentum on surprisingly positive services PMI figures from the Eurozone. The EUR/USD pair violated the bearish trendline resistance of $1.1220 to form the double top pattern at $1.1250.
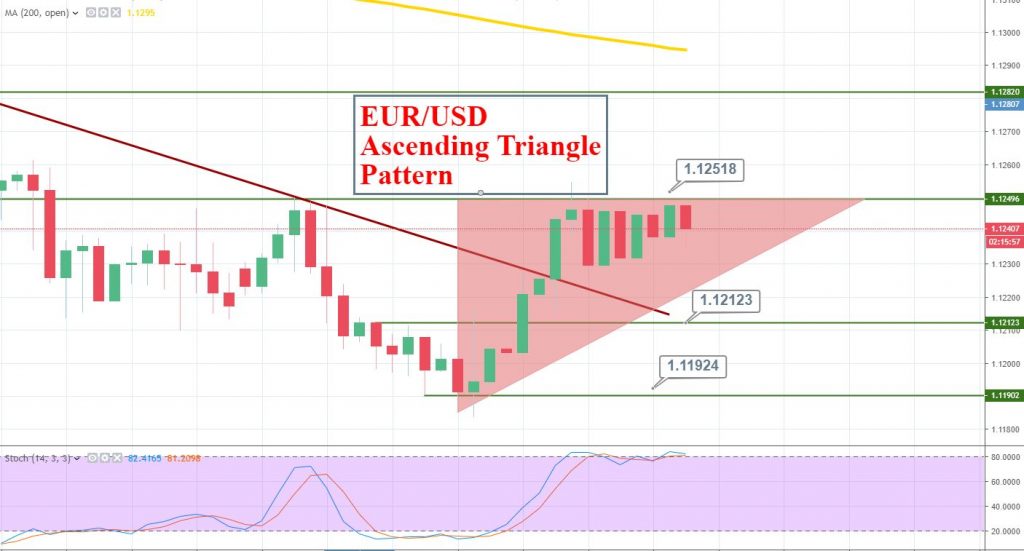
Zooming out on the 3-hour chart, we realized that the EUR/USD struggled to break 1.1250 level on April 1.
The pair has formed an ascending triangle pattern which is providing a strong resistance around $1.1250 and support around $1.1210.
Typically, the ascending triangle pattern breaks on the upper side. So a breakout of $1.1250 level can extend bullish rally until $1.1280.
Support Resistance
1.1217 1.1256
1.1196 1.1275
1.1157 1.1315
Key Trading Level: 1.1236
Consider taking a buy position above $1.1255 to with a stop loss below $1.1230 and take profit above $1.1280.
Good luck and stay tuned to FX Leaders for upcoming trade setups.
- Check out our free forex signals
- Follow the top economic events on FX Leaders economic calendar
- Trade better, discover more Forex Trading Strategies
- Open a FREE Trading Account
- Read our latest reviews on: Avatrade, Exness, HFM and XM
Related Articles


Sidebar rates
Related Posts
