Weekly Crypto Roundup
The bulls are back! How long will it take for the bears to wake up?

The bulls are back! How long will it take for the bears to wake up? Some might already assume the end of the bear market, but professional traders are not fully convinced yet. To find out what the chances are of a new bull market, let’s look at the charts of Bitcoin, Ethereum and the cryptocurrency market.
Bitfinex pairs are still in a premium. Bitcoin is trading nearly $300 higher on Bitfinex.
BTC/USD DAILY CHART
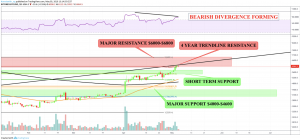
Bitcoin finally performed an EMA golden crossover but is currently fighting with major resistances. Bitcoin is at the 4 year trendline resistance right now and faces heavy resistance up to $6800. In addition, the RSI is performing a bearish divergence which indicates a correction wave is about to come. Bitcoin should find short-term support between $5400 and $5700 and after that, it could find support at the 200 & 50 EMAs at $4800. If both levels fail to hold, Bitcoin finds a major support at $4200-$4500. This key support level must hold for BTC to remain bullish.
BTC/USD WEEKLY CHART
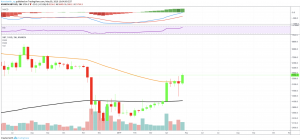
The MACD histogram is ticking higher again and the 50-week-EMA was bullishly broken. Both indicate bullishness.
BTC/USD MONTHLY CHART
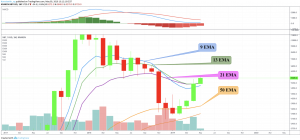
All Fibonacci EMAs are bullishly broken and the histogram is ticking higher. This is indeed a very bullish sign. However, it is important to note that the month has just begun and this monthly candle is nowhere near final.
ETH/USD DAILY CHART
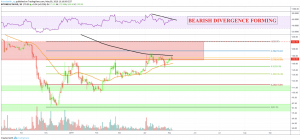
Ethereum is still fighting the 200-day-EMA as well as the golden pocket fib extension level. Both are located in heavy resistance area between $170 and $220. A rejection of the golden pocket level would act as confirmation of the bear trend. With the RSI performing a bearish divergence, we could assume a re-test of the support area at $100-$111 if the golden ratio level won’t be bullishly broken. Once the 200-day-EMA is bullishly broken, we can assume a re-test of the $200 mark.
TOTAL CRYPTO DAILY CHART
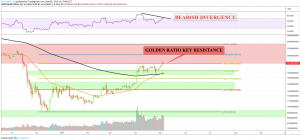
If any chart deserves to be seen as rather bearish, it is definitely the total cryptocurrency market chart. In fact, the golden ratio key resistance was still not bullishly broken and the RSI is performing a bearish divergence. While the market could find short-term support at the 200 and 50-day EMAs at the minor support area between $155b-$165b, a rejection of the golden ratio level would most likely lead to a decline down to the $126b-$140b support area. In fact, a heavy downward movement starting at the golden ratio level would be extremely bearish, as it would act as confirmation of the bear trend.
The top gainers of this week were
EDUCare, which surged by 107 percent,
KCash, which gained by 48 percent and
Arcblock, which rose by 51.50 percent.
Bitfinex remains under investigation and there are rumors that it plans to launch an exchange token to fill the monetary deficit. Tether remains a big risk for the holder of this coin. It is advised not to hold any funds in Tether.
- Check out our free forex signals
- Follow the top economic events on FX Leaders economic calendar
- Trade better, discover more Forex Trading Strategies
- Open a FREE Trading Account
- Read our latest reviews on: Avatrade, Exness, HFM and XM
Related Articles


Sidebar rates
Related Posts
