Gold Remains Supported By MAs, But the Test for Buyers Comes at $1,900
Gold has turned bullish this month, but there are obstacles above
Gold turned bearish in August last year after being bullish for around two years, as the trade tariffs at first and then the coronavirus outbreak were keeping the sentiment negative in financial markets, which kept safe havens bullish. Although, the safe haven status was transferred to cryptocurrencies which have turned massively bullish, while the traditional ones such as Gold turned bearish since last summer.
GOLD kept slipping lower, breaking the moving averages one after the other on the daily chart as we highlighted on the 2021 Gold forecast,which eventually turned into resistance, especially since December last year. In total Gold fell around $400, but it formed a bottom at $1,675 where it bounced twice from.
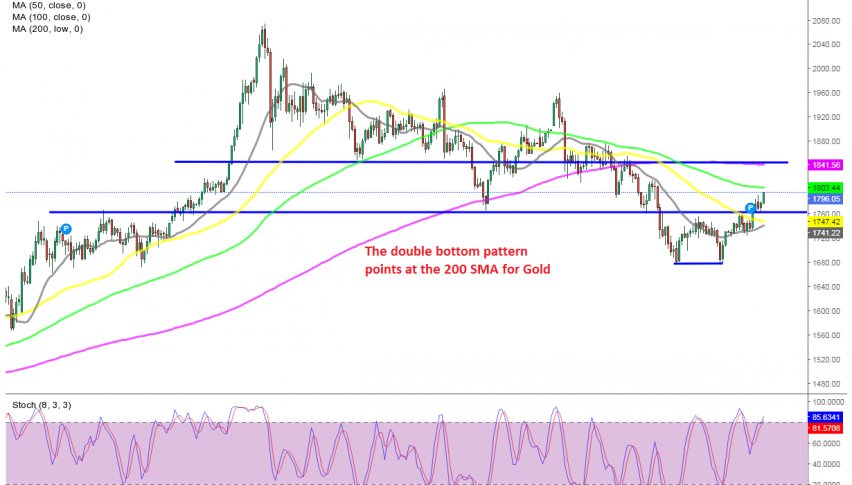
That formed a double bottom pattern, which became valid after the break of the neckline at $1,755. According to this pattern, the break of the neckline should take the price up to $1,935, where the 200 SMA (purple) stands ready to turn into resistance, after having provided support during the decline.
But, we have the 100 SMA (green) standing just above at $1,800. This moving average has been a solid support and resistance indicator recently, so it might bring the end of this retrace higher. We are following Gold, as we are trying to open a sell signal after this bullish move. If we get a signal wat the 100 SMA we might go short, but I am counting more on the 200 SMA, where the risk/reward ratio will be better for sellers.
- Check out our free forex signals
- Follow the top economic events on FX Leaders economic calendar
- Trade better, discover more Forex Trading Strategies
- Open a FREE Trading Account
- Read our latest reviews on: Avatrade, Exness, HFM and XM
Related Articles


Sidebar rates
Related Posts
