Buying the Retreat in Ethereum
Ethereum is finding resistance at the 50 daily SMA, after bouncing off the 100 SMA
Ethereum turned into one of the most bullish cryptocurrencies during the first half of this month, as Bitcoin and more than half of the crypto market was stagnating. Ethereum kept pushing to new highs, reaching $4,300 more than a week ago.
But, the crypto crash came last week and ETHEREUM lost more than $2,500, falling below $1,800 o Sunday, as the selloff resumed again. Bitcoin remained above last week’s high during the decline, which was a sign that this was the last decline in market.
Yesterday we saw a bullish reversal, with Ethereum turning higher after the hammer candlestick at the bottom on the H4 chart above, which is a bullish reversing signal. ETH/USD climbed around $1,000 higher yesterday, pushing above the 20 SMA (gray) but the 50 SMA (yellow) turned into resistance.
Today the price retreated down, but the 20 SMA turned into support on this chart. So, we decided to open a buy Ethereum signal above the 20 SMA and the price bounced off that moving average and now Ethereum is trading more than $500 above it.

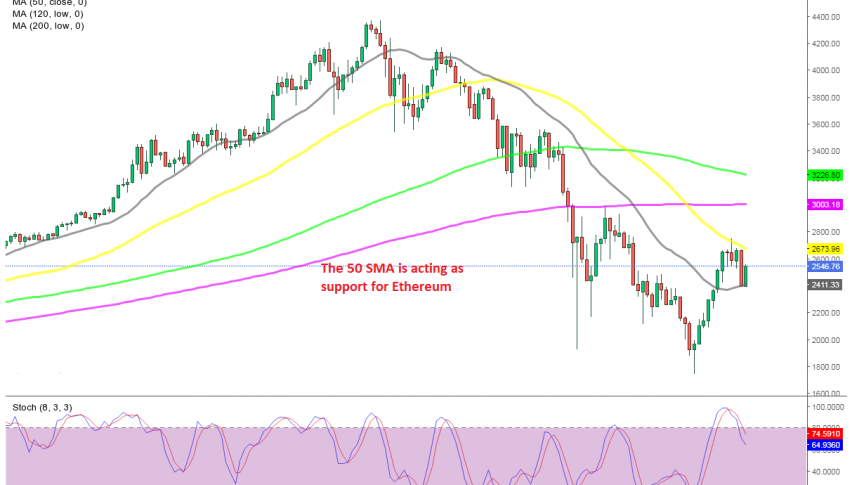
The 100 SMA provided support on the daily chart
On the daily chart, the 100 SMA (green) provided support. That moving average was pierced a couple of times, but the candlesticks didn’t close above it, so it didn’t count as a break. Ethereum bounced off this moving average yesterday but the 50 SMA (yellow) has turned into resistance now. Buyers will have to push above this moving average if the bullish trend is to resume soon, so we are watching the price action below the 50 SMA now, hoping that it will be broken soon.
- Check out our free forex signals
- Follow the top economic events on FX Leaders economic calendar
- Trade better, discover more Forex Trading Strategies
- Open a FREE Trading Account
- Read our latest reviews on: Avatrade, Exness, HFM and XM
Related Articles


Sidebar rates
Related Posts
