Chainlink Price Prediction: Could LINK Offer the Biggest Rebound After the Dip to $18?
-
- The downtrend in the Chainlink price continues as the MACD remains below the zero line.
- The RSI supports the bearish outlook on the 12-hour chart.
- LINK must hold above $14 to overturn the bearish run and resume the uptrend.
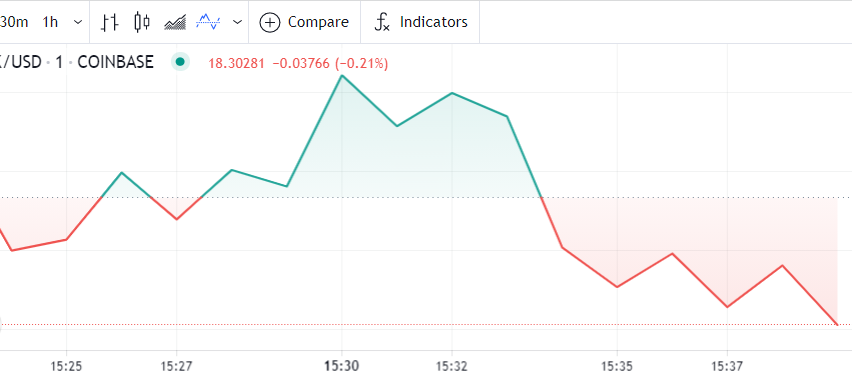
The Chainlink Price has more than halved since the all-time high of $54. At the time of writing, LINK exchanged hands at $16.85, while Data by CoinGecko shows that the live price feed oracle token has lost 5.8% over the past 24 hours. Despite the massive declines, bulls could turn the tables around for gains, with an eye to achieving a new record high close to $100 before the end of 2021.
Is Chainlink’s bearish outlook stoppable?
The 12-hour chart indicates a fading bullish outlook. However, the bears appear determined to push the Chainlink price close to $10, a support that came in handy during the crash in May. The Moving Average Convergence Divergence (MACD) indicator confirms this bearish narrative. It is worth noting that the trend momentum indicator remains below the mean line (0.00).
The MACD is a trend-following momentum indicator, used to confirm trading trends. However, it is occasionally used by traders to identify overbought and oversold zones. It is an indicator that triggers technical signals when the MACD line (blue) crosses above the signal line, giving a buy signal. On the other hand, the trend sends a sell signal when the MACD line crosses below the signal line, as illustrated by the Chainlink chart below.
Moreover, on June 21, we saw the LINK price make a brand-new high when it broke a short-term resistance of $22. However the MACD indicated that the momentum was not confirming the reversal upwards. The MACD kept declining, as the Chainlink price struggled to establish support around the $16 level. If the price feed oracle token fails to achieve this support, the MACD will continue its bearish divergence from the signal line, confirming that LINK will not reverse its downward trend, and that it is still in the sell zone.
LINK/USD 12-hour chart
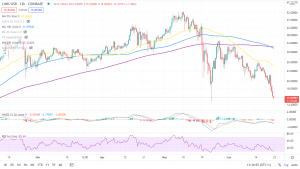
The Relative Strength Index (RSI) supports the continued bearish run on the 12-hour chart. With the RSI diving sharply towards the oversold zone, the declines in Chainlink may deepen. Note that the RSI is a trend indicator that measures the strength or power of the bulls or bears, depending on how steep the slope is. The RSI shows a steep shift towards the oversold zone, indicating that the bears are more powerful, and the bearish outlook could extend or carry on in the near term.
At the time of writing, LINK was struggling to secure support at $16. Closing the day below this level would trigger more sell orders, pushing LINK towards the next support level at $14, going beyond the $18 dip experienced at the start of the week.
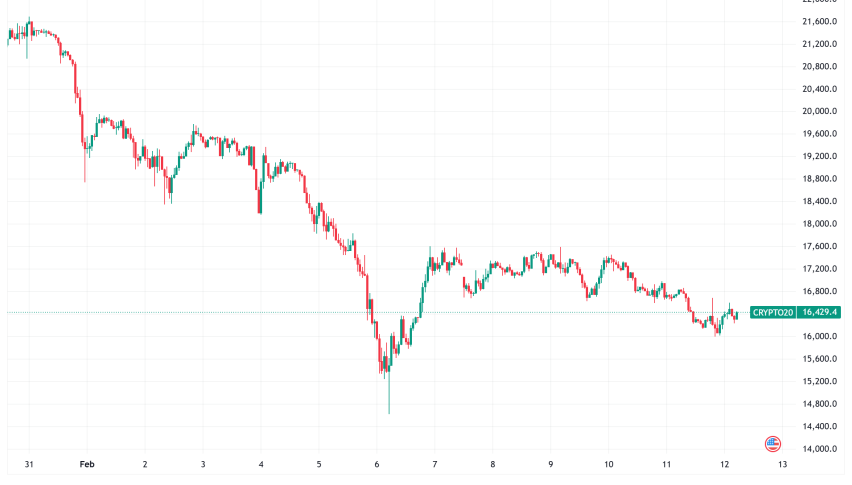
The bearish outlook is not unique to Chainlink, as the entire crypto market continues to decline, with demand-side pressures weakening for Bitcoin (BTC), amid regulatory fears and a crackdown on Bitcoin miners by the Chinese government. This saw Bitcoin dip below the support level at $30,000 earlier this week – a support it has held for a long time – and we saw it drop to the lowest level since January.
On the upside, the Chainlink 2.0 launch could bolster the price to higher levels. The Chainlink 2.0 update is aimed at creating hybrid smart contracts, which will increase access to off-chain resources. Furthermore, the upgraded system is expected to smoothen oracles, in order to resolve off-chain disputes. The main benefits for the new update to the Chainlink system are security and scalability.
Generally, analyses give a positive indication that the fundamentals of the project are solid and that Chainlink has remained proactive in developing and launching products over the past year. The signs point to the LINK/USD price driving past the ATH, to trade between $80 and $100 over the next few years. Therefore, the current dip could be the best time to buy the token.
- Check out our free forex signals
- Follow the top economic events on FX Leaders economic calendar
- Trade better, discover more Forex Trading Strategies
- Open a FREE Trading Account
- Read our latest reviews on: Avatrade, Exness, HFM and XM
Related Articles

Sidebar rates
Related Posts
