Shiba Inu (SHIB/USD) Enters Oversold Zone – Ready for a Sell Stop?
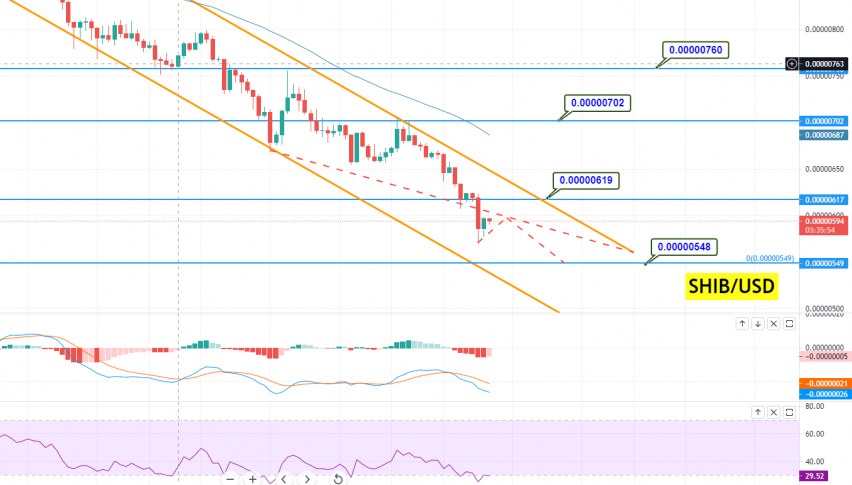
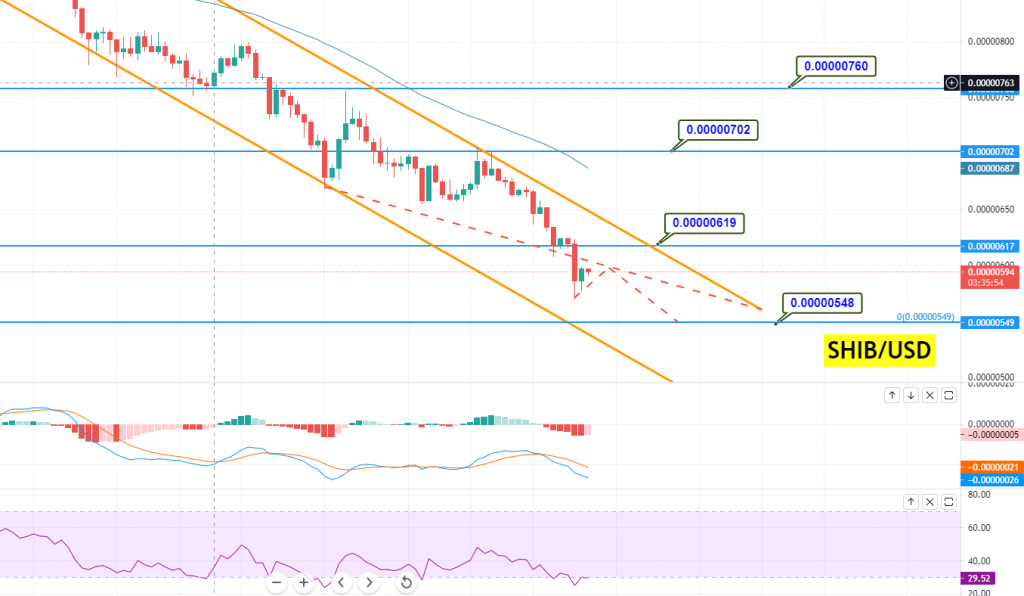
The SHIB/USD coin pair extended its previous long bearish performance and remained in the bearish zone near below the $0.000006 level
•
Last updated: Tuesday, July 20, 2021
SHIB/USD
Recent Crash in Crypto Space Drags Shiba Inu Down to $0.0000059
Shiba Inu Under Pressure on the Back of Stronger US Dollar
SHIB/USD Technical Outlook – Can SHIB Drop to $0.0000054?
- Check out our free forex signals
- Follow the top economic events on FX Leaders economic calendar
- Trade better, discover more Forex Trading Strategies
- Open a FREE Trading Account
- Read our latest reviews on: Avatrade, Exness, HFM and XM
ABOUT THE AUTHOR
See More
Arslan Butt
Lead Markets Analyst – Multi-Asset (FX, Commodities, Crypto)
Arslan Butt serves as the Lead Commodities and Indices Analyst, bringing a wealth of expertise to the field. With an MBA in Behavioral Finance and active progress towards a Ph.D., Arslan possesses a deep understanding of market dynamics.
His professional journey includes a significant role as a senior analyst at a leading brokerage firm, complementing his extensive experience as a market analyst and day trader. Adept in educating others, Arslan has a commendable track record as an instructor and public speaker.
His incisive analyses, particularly within the realms of cryptocurrency and forex markets, are showcased across esteemed financial publications such as ForexCrunch, InsideBitcoins, and EconomyWatch, solidifying his reputation in the financial community.
Related Articles


Sidebar rates
Related Posts
