Breakout Expected in Doge Coin and Shiba Inu, As They Get Squeezed Into to Tip of the Triangle
The trading range is getting extremely tight for Shiba Inu and Dogecoin, suggesting a breakout
Dogecoin and Shiba Inu coin have been among the weakest cryptocurrencies since the reversal down in May. They have lost nearly 80% of the value and continue to keep a bearish bias, with moving averages continuing to provide resistance during retraces higher and pushing the trend down. Besides that, they haven’t been able to benefit from the improvement in the crypto market sentiment in the last two weeks, showing further weakness and uncertainty for these cryptos.
Dogecoin Analysis – DOGE/USD H4 Chart
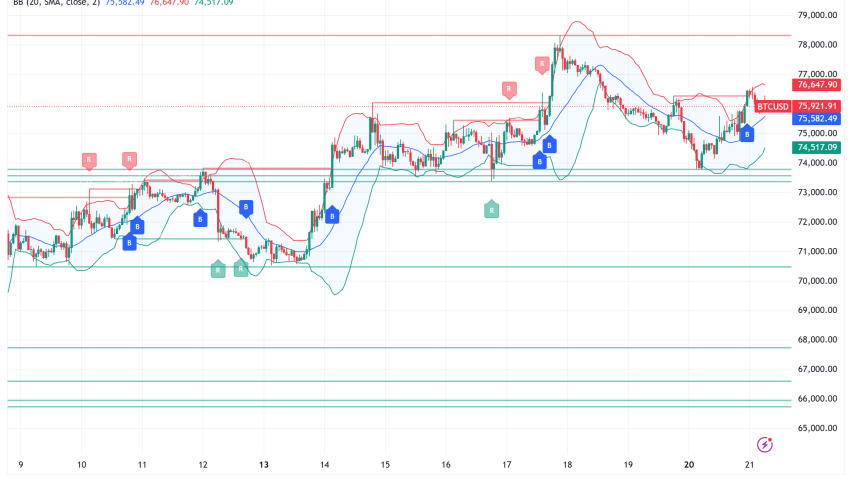
The smaller moving averages such as the 20 SMA (gray) and the 50 SMA (yellow), have been the ultimate resistance indicators on the H4 chart above when the decline picked up pace, while the 200 SMA (purple) has been acting as resistance when retraces were stronger.
Dogecoin Live Chart
We are in one of those periods, when the 200 SMA has come into play again and it is pushing the highs lower for DOGE/USD. The smaller moving averages, which are acting as support at the bottom, pushing the lows higher, therefore squeezing the price in between them. This points to a breakout soon, which might be in either direction, since Dogecoin has been quite bearish in recent months, but on the other hand, the improved sentiment in the crypto market might pull them up above the 200 SMA.
Dogecoin Analysis – DOGE/USD Daily Chart

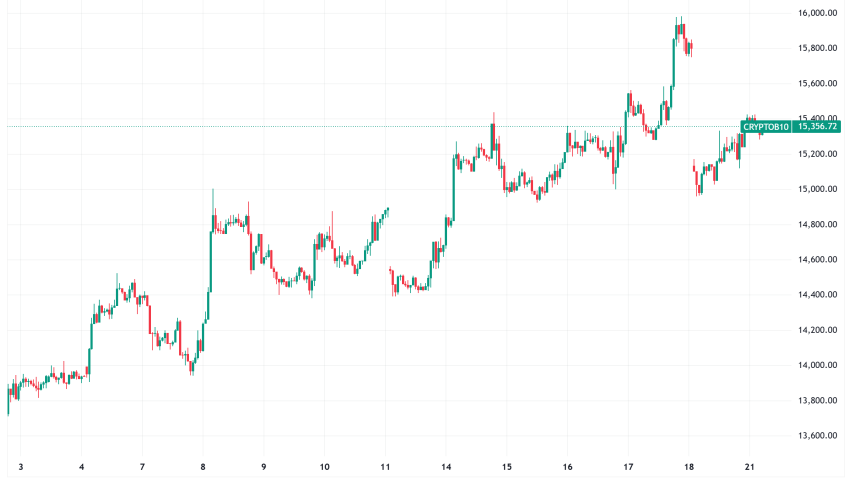
Dogecoin getting squeezed between the 50 and 200 SMAs
On the daily chart, we see that it was the same moving averages that were pushing the price down, the 20 and 50 SMAs, while the 200 SMA was acting as support on this timeframe. The price has moved above the 20 SMA (gray) now, but the trend remains bearish until buyers break above the 50 SMA (yellow). So, Dogecoin is bouncing between the 50 SMA and the 200 SMA, and the range is getting narrower, so a breakout is about to happen in this timeframe chart as well.

The 50 SMA is pushing Shiba Inu down
Shiba Inu Coin Analysis – SHIB/USD H4 Chart
Looking at the Shiba Inu coin chart, we see that moving averages were pushing the price down during most of July. The 100 SMA (green) took over lately and the price pierced above in late last week, but it has come back down and now the 50 SMA is acting as support. So, a breakout is expected to happen here as well, These two cryptocurrencies are similar, so I think that they will make the breakout around the same time, although not at the same moment. So, when that happens in one of the cryptocurrencies mentioned above, we can use it to see the direction and take a position on the other crypto.
The 100 SMA is pushing down the Shiba Inu coin
- Check out our free forex signals
- Follow the top economic events on FX Leaders economic calendar
- Trade better, discover more Forex Trading Strategies
- Open a FREE Trading Account
- Read our latest reviews on: Avatrade, Exness, HFM and XM
Related Articles

Sidebar rates
Related Posts
