Is This the Reverse in Cryptos, With Ethereum Bouncing Above $3,000 Again?
Etheruem is starting to reverse higher after MAs provided solid support on different timeframes
Cryptocurrencies have been on a bullish trend for a month now, since the bullish reversal toward the end of July. They have been marching higher, with a pause during the first week of August, which suggests that the decline from the crypto crackdown has ended and the larger bullish trend is back on.
Ethereum has been even more bullish than most of the market, having kept the upside momentum going non-stop, even during the consolidation period in the first week of August in the crypto market. During this bullish month, smaller moving averages such as the 20 SMA (gray) and the 50 SMA (yellow) were providing support during pullbacks, which also confirms the strong bullish bias in Ethereum.
Ethereum almost doubled in price until earlier this week, while BITCOIN only gained around 70% up to the top at $48,000. Although, since Tuesday we have seen a pullback in the crypto market, but this pullback wasn’t looking sustainable even before the bounce.
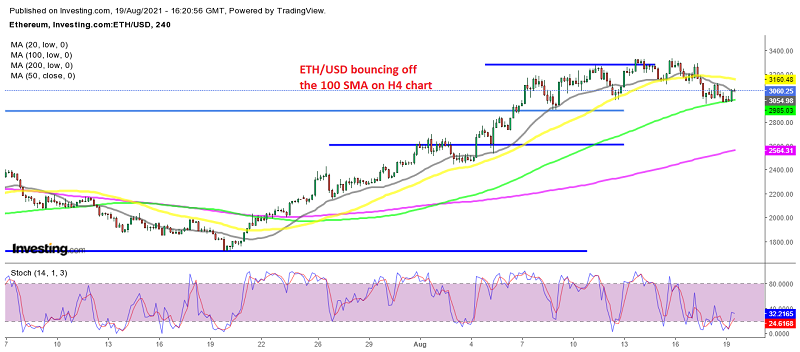
Now the price has bounced higher in most cryptocurrencies, which suggests that the pullback was more of a profit-taking action from buyers who had gone long earlier at lower prices. As a result, we decided to buy ETHEREUM and the place we were looking at the 100 SMA (green).
This moving average was next in line after the smaller ones which were providing support during this bullish trend were broken. Ethereum declined below the $3,000 level but has bounced from $2,960 and has climbed above the $3,000 level again now, gaining around $100. We are in profit with our Ethereum signal which we opened earlier today above the 100 SMA and we are holding it, hoping that the bounce continues further and the bullish trend resumes.

Ethereum reversing at the 20 SMA on the daily chart
On the daily chart, the 20 and the 50 SMAs were providing resistance when Ethereum was sliding lower in the previous three months, but they were broken after the bullish reversal. Now it seems like these moving averages are turning into support, which supports the idea of the trend reversal.
Here, we see that the 20 SMA (gray) is acting as support on the daily chart and today the price is starting to bounce off of it, after forming a doji candlestick yesterday, which is a bullish reversing signal. So, the bullish reversal is beginning here as well, after the last two bearish days.
- Check out our free forex signals
- Follow the top economic events on FX Leaders economic calendar
- Trade better, discover more Forex Trading Strategies
- Open a FREE Trading Account
- Read our latest reviews on: Avatrade, Exness, HFM and XM
Related Articles


Sidebar rates
Related Posts
Ava

