Polkadot (DOT): Completely Recovers from this Year’s Market Crash
*DOT: The early gains of 2021, erased by the crypto market crash, have now been recovered
Resilient
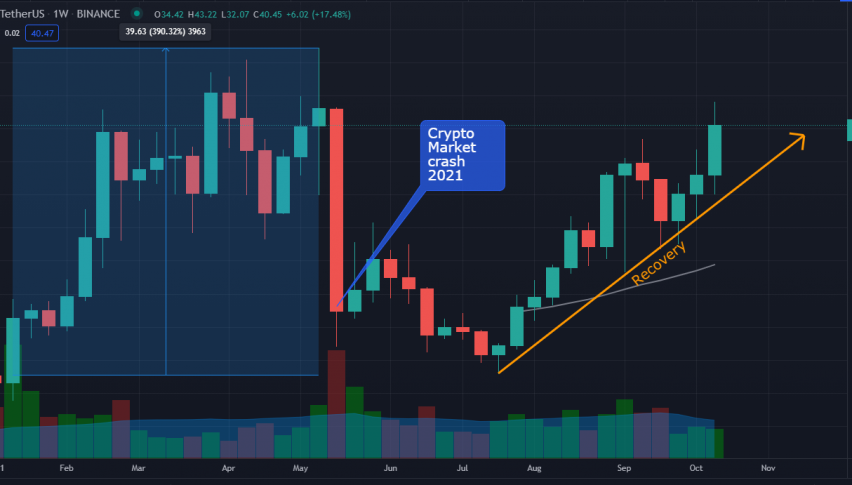
Polkadot (DOT) has returned to where it came from. Early this year, it rallied above $10.00, rising all the way up to $49.723 (a 390+% gain for the year) before coming back to earth and giving back almost all of its gains during the market crash of May 2021.
Since then, DOT has been on a steady climb, as it almost fully recovers the entire market crash losses it encountered mid-year 2021. Since the $10.37 low of July 2021, DOT has rallied to a high of $32.07 this week – marking an astounding 300+% gain in less than 3 months.
V-Shaped Recovery
What we saw in DOT is characterized by technical analysts as a “V-shaped recovery” – this is the best-case scenario after a sharp decline, like the crypto crash last May. It is “V-shaped” because, aside from the price chart looking like the letter “V”, its recovery is quick, sharp and sustainable. It totally negated the negative sentiment that the crypto crash brought to it.
DOT Technical Analysis
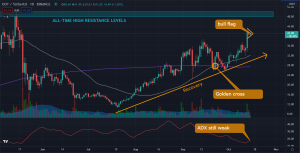
*DOT daily timeframe chart, bullish case growing
Here are key some technical observations that support Polkadot’s bullish case:
-
- Didn’t fall below the $10.00 major psychological support level during the market crash
- A golden cross formed as the 50-day moving average (gray line) crossed above the 200-day moving average (purple line)
- A bull flag is forming after the most recent breakout; it looks like it will be heading towards all-time high levels soon.
Given how strong the cryptocurrency market has been lately, led by Bitcoin’s potential return to $60,000, it seems like DOT and all the other altcoins may soon be heading towards all-time high levels as well.
DOT Trade Idea: Buy the momentum flag pattern
Buy: 42.00-43.22
Stop loss: 39.00 (low of the flag)
Target: 48.00-50.00 (sell into strength)
VAR: 0.25 to 0.50 (risk only 0.25%-0.50% of your portfolio since this is a risk trade)
RRR: 2.00-2.67
Remember to always compute for the proper position size and exercise risk management, as indicated above. This is a high-risk momentum trade: you should be able to get in and out of this trade quickly. Immediately sell into strength if the price goes in your favor, and immediately sell into weakness with a final stop loss at the price indicated above.
- Check out our free forex signals
- Follow the top economic events on FX Leaders economic calendar
- Trade better, discover more Forex Trading Strategies
- Open a FREE Trading Account
- Read our latest reviews on: Avatrade, Exness, HFM and XM
Related Articles

Sidebar rates
Related Posts
