Axie Infinity and Fantom Prediction, as they Trade at Key Levels

AXS/USD Breaking from Consolidation. Can It Get Buyers?
Axie Infinity (AXS/USD) has been oscillating between $115 support and $144 resistance since the beginning of the month. The pair attempted to break higher on October 4 but came under bearish pressure. At the time of writing, AXS/USD was trading at $139, at a slight retrace, and looking to go higher.
Overall, AXS/US has gone up 13.59% in the past 24 hours, bringing the total gains to 15.65% in the past week. The bullish sentiment is crawling back to the crypto market. In the past 24 hours, Bitcoin and Ethereum have turned at 4.17%, and 8.71% respectively, and Axie Infinity could be benefiting from the bullish wave. Can AXS/USD break above the consolidation to open a buy trade, or will it remain range-bound?
– 4-Hour Technical Outlook
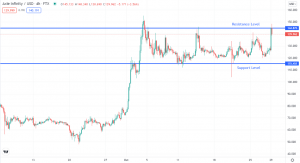
Looking at the 4-hour chart above, AXS/USD is attempting to break above the $144 resistance level. The prices tested this level on October 4 and October 14. If they finally surge past this it, we might see a bull run.
Similarly, AXS/USD found support at $115 on October 11, and lower prices have been rejected at this level since then. If there is a price reversal, we could see AXS/USD touch the support.
AXS/USD Trade Idea
We recommend patience, as we wait for prices to break clearly above the resistance before we go long. We also need to see a confirmation candle on the daily chart. If AXS/USD breaks above the resistance, it may be on its way to setting new highs. However, AXS/USD can still reverse towards the $115 support level, or even go lower.
Is Fantom Set for Major Correction?
Fantom (FTM/USD) has been one of the strongest performers in October. It rose from a low of 1.28 on October 6, to an all-time high slightly above 3.45 on October 28. That’s almost a three-fold gain in about three weeks, with the surge connected to the growing popularity of DeFi platforms and the crypto sentiment overall.
Nonetheless, FTM/USD is showing weaknesses, as the chart below shows.
– A 4-Hour Technical Outlook
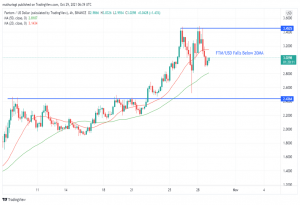
Looking at the 4-hour chart, we can see that FTM/USD hit the ATH of 3.45 on October 26, before prices plunged to 2.5. The area at 3.45 is already turning into a major resistance, as FTM/USD was resisted again on October 28 and is now retreating down. Such price action behavior suggests that the resistance continues to hold, and FTM/USD could be set for a major correction.
Another bearish sign on FTM/USD is the break below the 20 MA. At the current price of 3.02, FTM/USD is trading below the 20 MA, which, together with the 50 MA, has been supporting prices since mid-October. Although the crypto token is trading above the 50 MA, it remains under bearish pressure as long as the 3.45 resistance holds. We will watch the price behavior over the next few days and see if FTM/USD breaks below the 50 MA. If this happens, we will be set for a major correction, with the next support at 2.45.
FTM/USD Trade Idea
There is no clear trade idea on FTM/USD. We maintain a bearish view in the short-term, but bullish in the medium to long-term. If FTM/USD breaks below the 50 MA, we could see it claim the 2.4 support or further down at 2.0.
We will consider buy trades at the mentioned support areas, after further price action confirmation. However, I maintain that FTM/USD must breach the 3.45 level before we see a new all-time high.
- Check out our free forex signals
- Follow the top economic events on FX Leaders economic calendar
- Trade better, discover more Forex Trading Strategies
- Open a FREE Trading Account
- Read our latest reviews on: Avatrade, Exness, HFM and XM
Related Articles


Sidebar rates
Related Posts
