Crude Oil Bounces Off the 50 SMA, As Inflation Surges to 7.5% in the US
US inflation doesn't seem to stop as it moves higher to 7.5% in January, but Oil is not stopping either
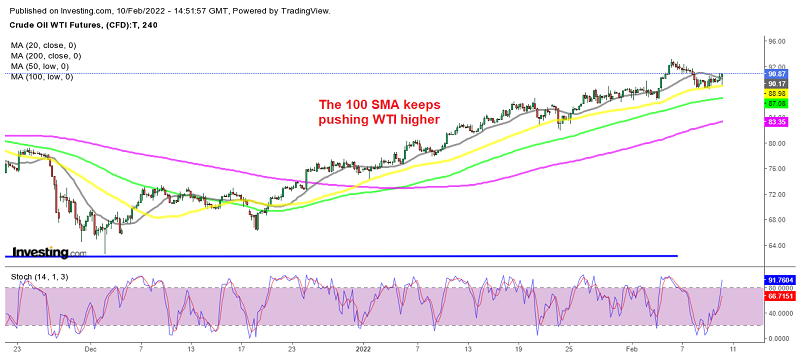
Crude oil remains quite bullish on the long term charts, despite the latest retreat after the US CPI (consumer price index) report, which was released just a while ago. This report came out quite strong once again, showing that inflation is not stopping, and one of the reasons for this is the price of oil, of course, which has been on the strongest bullish run ever during the last two years.
During the last two months of 2021, we saw a retreat as a result of the omicron variant spreading in China and the rest of the world, but now, this variant has proven to be quite mild, so restrictions have been light, and judging from what is going on, it is likely that in spring, all restrictions will be lifted, and the coronavirus pandemic will be heading towards an end. This has improved the economic sentiment and the sentiment in the financial markets. The US economy has picked up pace once again, which means higher demand for crude oil.
Moving averages have been working well as support for US WTI Crude on the H4 chart, particularly the 50 SMA (yellow). Yesterday we decided to open a buy signal in oil at this moving average, and at some point today, we were around 150 pips in profit, as oil resumed the uptrend. But, the increasing US inflation, as shown in the January CPI report below, sent the USD higher and crude oil lower. However, the 50 SMA held again as support, rejecting the price, so now oil is moving higher again, and we are more than 100 pips in profit.
US January 2022 CPI Inflation Report

- January CPI YoY +7.5% vs +7.3% expected
- Highest reading in 40 years
- December CPI YoY was 7.0%
- CPI MoM +0.6% vs +0.5% expected
- Prior CPI MoM was +0.6%
- Real weekly earnings -0.5% vs +0.1% prior (revised to -0.3%)
- Full report
Core CPI:
- January core CPI ex food and energy YoY +6.0% vs +5.9% expected
- Prior core CPI YoY +5.5%
- January core CPI MOM +0.6% vs +0.5% exp
- Prior core MoM +0.6%
Details MoM:
- Food +0.9%
- Housing +0.7%
- Owners equivalent rent +0.4%
- Energy +0.9%
- Gasoline -0.8%
- New vehicles 0.0%
- Used cars and trucks +1.5%
- Apparel +1.1%
- Services +0.4%
- Medical care +0.6%
- Lodging away from home -3.9%
The US dollar has jumped, and the market is now pricing a 43% chance of a 50 basis point hike in March, which is up from 30% before the data. The Fed is now pricing in six rate hikes for 2022 and the US 2-year yields are up by eight basis points, to 1.4300%.
US WTI Crude Oil Live Chart
- Check out our free forex signals
- Follow the top economic events on FX Leaders economic calendar
- Trade better, discover more Forex Trading Strategies
- Open a FREE Trading Account
- Read our latest reviews on: Avatrade, Exness, HFM and XM
Related Articles


Sidebar rates
Related Posts
