We Continue to Sell Retraces in EUR/GBP
EUR/GBP started reversing at the 200 SMA yesterday which stands at around 0.86 and we opened another sell forex signal here
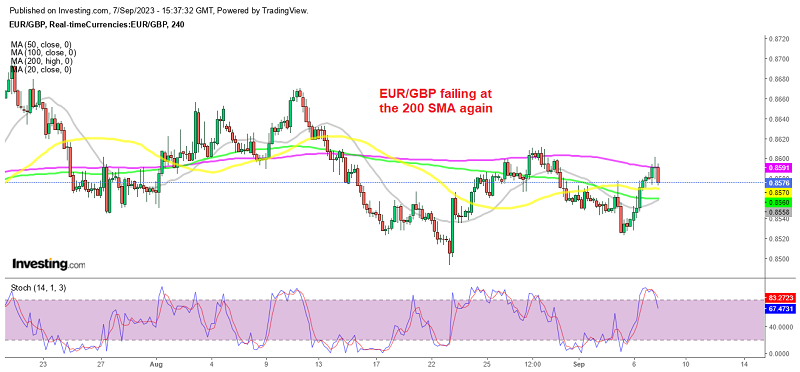
EUR/GBP has been making lower highs since early this year, which means that sellers are in control, with inflation being higher in Britain and the Bank of England being more hawkish than the ECB. This has been keeping EUR/GBP on a bearish trend, although a support zone has formed around the 0.85 level.
We saw a bounce in the price on Wednesday off this zone, which sent this pair peeking just above 0.86 yesterday. But, the 200 SMA (purple) has been acting as support and resistance and the price formed a doji candlestick on the H4 chart, which is a bearish reversing signal. We decided to open a sell EUR/GBP signal below the 200 SMA and soon after sellers started to come back. As a result, the following H4 candlestick closed pretty bearish, indicating that the downtrend was resuming.
So, besides the technical picture which is pointing lower, at least until 0.85, in the current market scenario, the Euro is experiencing a decline in its value in comparison to the Pound Sterling (GBP) due to central bank divergence. This decline can be attributed to two key factors: hesitation to place funds into riskier investments (risk-off impulse) and the anticipation that the European Central Bank (ECB) will maintain its current interest rates without any changes, as the European economy continues to show signs of increasing weakness which might send the Eurozone economy into a recession.
On the other hand, the Bank of England (BoE) stands out among central banks, as market analysts predict that it is likely to increase interest rates by 25 basis points (bps) in September, while most major central banks have already stopped raising interest rates. This expected rate hike by the BoE has garnered attention from investors and traders and is keeping the GBP in demand in rapport with the Euro.
EUR/GBP Live Chart
- Check out our free forex signals
- Follow the top economic events on FX Leaders economic calendar
- Trade better, discover more Forex Trading Strategies
- Open a FREE Trading Account
- Read our latest reviews on: Avatrade, Exness, HFM and XM
Related Articles
Sidebar rates
Related Posts
