Ripple (XRP/USD) Price Prediction: Eyes $0.6982 Amid Bullish Breakout Signals
In the constantly shifting landscape of cryptocurrency markets, Ripple (XRP/USD) presents an intriguing case study for both investors...

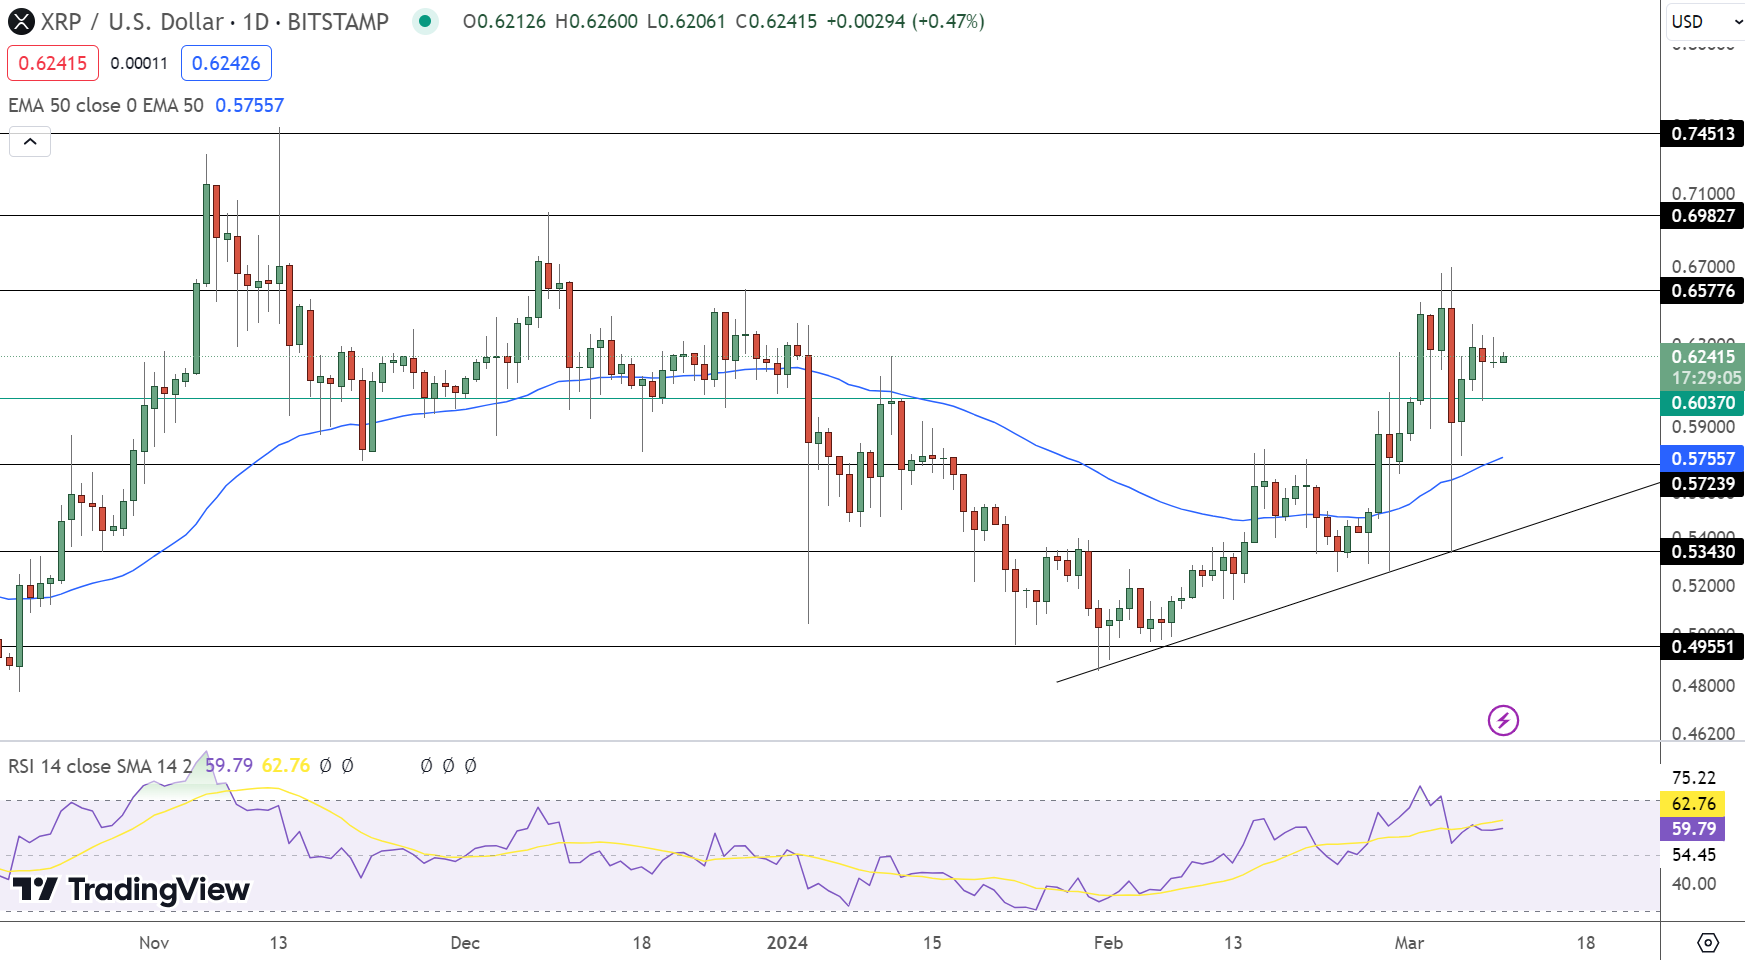
In the constantly shifting landscape of cryptocurrency markets, Ripple (XRP/USD) presents an intriguing case study for both investors and analysts. As of today, the live XRP price stands at $0.616078, with a substantial 24-hour trading volume of $1,452,415,137.
XRP/USD Price ChartDespite a slight downturn of 1.34% in the last 24 hours, XRP maintains its position as the sixth-largest cryptocurrency by market cap, which currently hovers around $33,722,173,826. With a circulating supply of 54,736,825,690 XRP out of a maximum of 100,000,000,000, the digital currency continues to capture the attention of the market.
Ripple (XRP/USD) Price Prediction: Technical Outlook
The technical analysis of XRP/USD highlights key price levels that are critical for understanding its short-term trajectory. The pivot point, marked at $0.6037, serves as a baseline for bullish or bearish trends. Resistance levels are identified at $0.6578, $0.6983, and $0.7451, each representing potential hurdles for upward movements. Conversely, support levels at $0.5724, $0.5343, and $0.4955 offer cushions that could stabilize price declines.
Patterns Shaping XRP’s Outlook: Current technical indicators provide a mixed yet optimistic view. The Relative Strength Index (RSI), standing at 59, suggests that XRP is neither overbought nor oversold, indicating a potential for further movement in either direction. Additionally, the 50-Day Exponential Moving Average (EMA) at $0.58 underscores a bullish undertone, hinting at underlying market strength.
A notable feature in XRP’s chart is the formation of a double top pattern around the $0.6577 level. This pattern typically signals a resistance point that, if overcome, could pave the way for a bullish breakout. A decisive move above this resistance can unlock further buying opportunities, potentially driving prices towards $0.6982 or higher.
Conclusion: The technical outlook for Ripple (XRP/USD) is cautiously optimistic. The currency shows promise of continuing its bullish trend, especially if it sustains above the pivot point of $0.6037. However, traders and investors must remain vigilant, as a break below this critical level could trigger a sharp selling trend.
- Check out our free forex signals
- Follow the top economic events on FX Leaders economic calendar
- Trade better, discover more Forex Trading Strategies
- Open a FREE Trading Account
- Read our latest reviews on: Avatrade, Exness, HFM and XM
Related Articles
Sidebar rates
Related Posts
