Brazilian Real Still in Sideways Trend – Little Effect from Inflation Data
Both countries published inflation data yesterday, with positive surprises for the pair. Market sentiment remained mixed as the dollar mood
Both countries published inflation data yesterday, with positive surprises for the pair. Market sentiment remained mixed as the dollar mood remains uncertain.
The Real remains range bound between 4.99 and 4.90, but with a series of higher lows. The highs have been bouncing off the 4.99 level creating a resistance area just short of the 5.00 big figure.
Price action has been in an upward sloping range since its recent peak on January 22. Giving rise to an upward sloping triangle pattern. We may be in this sideways market for a few days as central bank meetings are scheduled for both nations next week on the 20th.
A lot will depend on what the Fed post meeting press conference sounds like. Mainly because it seems clear from Fed chair Powell’s comments that they won’t act on interest rates at this meeting. From the Brazilian central bank, the market is expecting a cut of 50bp, from 11.25% to 10.75%.
The Central Bank of Brazil doesn’t hold press conferences, so we’ll have to watch for comments from the officials at a later date. The 50bp cut in Brazil’s main interest rate may already be priced into the market. But in any case it may cause volatility once the fact happens.
The interest rate differential closes in favor of the dollar and we know that the Fed is likely to take some more time before cutting rates. While the BCB has a lot of catching up to do, Brazil’s inflation data YoY was 4.50% compared to 4.51% last month.
Technical Analysis
From the day chart for USD/BRL below we can see the triangle pattern (yellow area), with the 5 attempts to break the resistance area just short of 5.00. The upward sloping triangle is generally a bullish figure when it appears after a bullish trend.
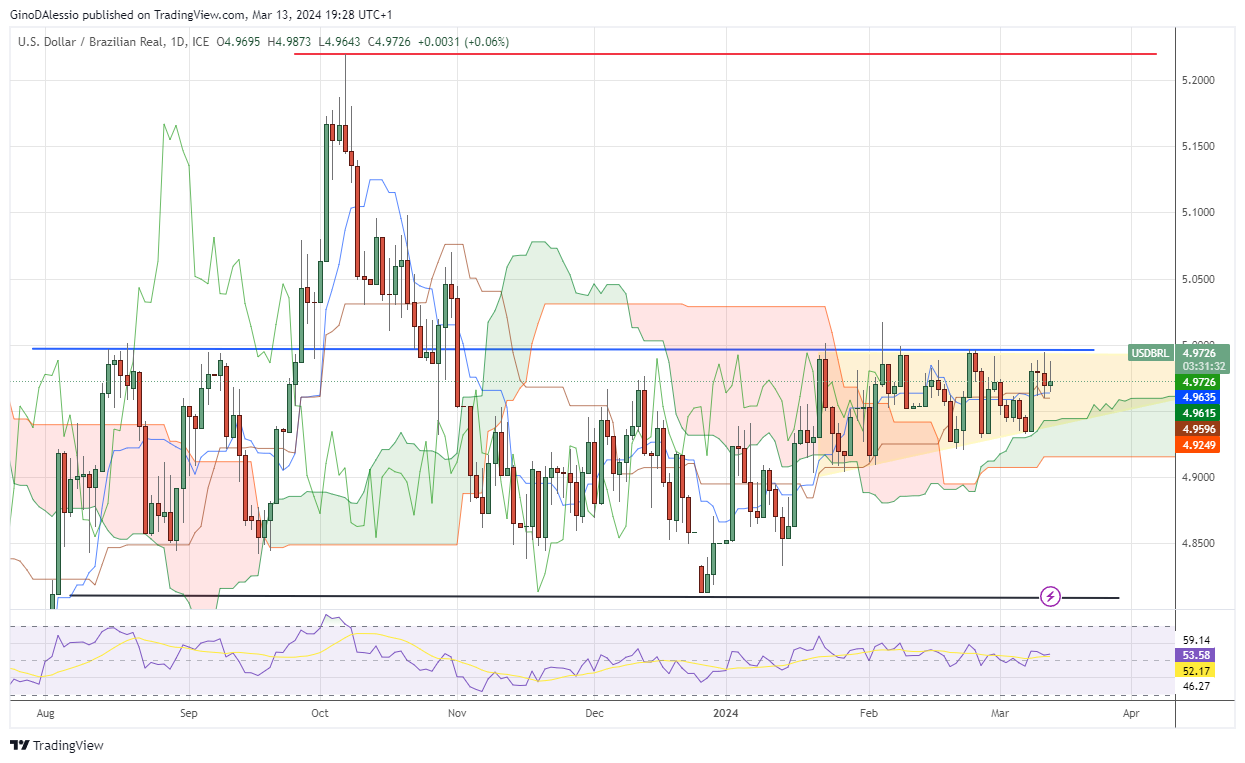
But in this case we have a lot of sideways price action preceding it, so the pre-breakout interpretation of this pattern is uncertain. What does seem likely is that a breakout to the downside would find close support within the cloud.
Then further support around 4.81 (black line). While a bullish breakout would see support around 5.22 which was the recent high on October 6, 2023. We can also see how a lot of the price action since August last year has happened between the blue resistance line and the black support line.
A break of either of these lines could open the way for further price action in the same direction.
- Check out our free forex signals
- Follow the top economic events on FX Leaders economic calendar
- Trade better, discover more Forex Trading Strategies
- Open a FREE Trading Account
- Read our latest reviews on: Avatrade, Exness, HFM and XM
Related Articles


Sidebar rates
Related Posts
