Forex Signals Brief May 20: FOMC Member Speeches on Agenda
Today there are only FED comments, but during the week there are important economic events.

Last week the attention was on the US CPI (Consumer Price Index) for April, with markets fearing a soft number mostly. Consumer inflation posted a slight slowdown from 0.4% to 0.3%, which was enough for markets to raise the odds of FED interest rate cuts, sending the USD tumbling lower.

CPI inflation has remained stubbornly sticky during Q1 of 2024 which got markets and the FED worried, so the slight decline in April was somewhat of a relief. The PPI (Producer Price Index) the previous day showed a decent jump for April, however, that should be reflected in the coming months.
The Q1 Wage Price Index from Australia and the New Zealand Inflation Expectations came in lower, but commodity dollars ended the week on a bullish note, as risk sentiment remained positive. Unemployment Claims cooled off last wee, relaxing some fears about weakness in the US labour market, but Building Permits and Housing Starts came in below expectations, which indicates that the housing market is showing weakness, as interest rates remain high thanks to the FED policy.
This Week’s Market Expectations
Today the economic calendar is almost empty, apart from numerous speeches from FOMC Members, such as Bostic, Mester, Broadbent etc. During the week, we have a number of inflation reports, starting with the Canadian CPI inflation for April tomorrow and the UK CPI on Wednesday. Below is the economic calendar for the week:
Monday:
- PBoC LPR (Loan Prime Rate): The People’s Bank of China will announce the Loan Prime Rate, which could provide insights into China’s monetary policy stance.
- Fed’s Speeches: Remarks from Bostic, Mester, Broadbent or Christopher Waller, all members of the Federal Reserve’s Board of Governors, could provide clues about the Fed’s monetary policy outlook.
Tuesday:
- RBA Meeting Minutes: The Reserve Bank of Australia will release the minutes of its recent monetary policy meeting, offering insights into the central bank’s deliberations and future policy direction.
- Canada CPI (Consumer Price Index): Canada will release its CPI data, which measures changes in the price level of a basket of consumer goods and services, providing key information about inflation trends.
Wednesday:
- RBNZ Monetary Policy Decision: The Reserve Bank of New Zealand will announce its monetary policy decision, including any changes to interest rates or monetary policy stance.
- UK CPI (Consumer Price Index): The United Kingdom will release its CPI data, providing insights into inflationary pressures in the UK economy.
- FOMC Minutes: The Federal Open Market Committee will release the minutes of its recent meeting, offering detailed insights into the Fed’s monetary policy discussions and future outlook.
Thursday:
- New Zealand Q1 Retail Sales: New Zealand will release retail sales data for the first quarter, providing insights into consumer spending patterns.
- Australia/Japan/Eurozone/UK/US Flash PMIs (Purchasing Managers’ Index): Flash PMI data from major economies will offer early indicators of manufacturing and services sector activity for the current month.
- US Jobless Claims: The weekly jobless claims report will provide insights into the labor market’s health and the pace of recovery.
Friday:
- Japan CPI (Consumer Price Index): Japan will release its CPI data, offering insights into inflation trends in the Japanese economy.
- UK Retail Sales: Retail sales data from the UK will provide insights into consumer spending patterns.
- Canada Retail Sales: Canada will release retail sales data, offering insights into consumer spending trends.
- US Durable Goods Orders: The US will release data on durable goods orders, providing insights into demand for long-lasting goods, a key indicator of economic activity.
Market Impact Summary:
- AUD/USD and NZD/USD: Influenced by RBA minutes, RBNZ policy decision, Australian Flash PMIs, and New Zealand Retail Sales.
- USD: Driven by Fed’s Waller speech, FOMC minutes, US Jobless Claims, and Durable Goods Orders.
- EUR: Impacted by Eurozone Flash PMIs and Wage Growth data.
- GBP: Affected by UK CPI and Retail Sales.
- CAD: Influenced by Canada CPI and Retail Sales.
- JPY: Driven by Japan CPI.
Last week there was a lot of volatility in financial markets, with the USD retreating most of the time, however there were some decent bounces as well, so we tried both sides of the market. We opened 21 trading signals in total, ending up with 15 winning forex signals and 5 losing ones, while the buy BTC signal remains open, however it is well in profit and heading toward the take profit target.
Gold Opens Above $2,400
GOLD closed above $2,4000 for the first time ever last Friday. The market’s response to the softer-than-expected CPI data spurred a flight to safe-haven assets like gold, driving the XAU/USD pair back towards the $2,400 level. The rebound from the $2,330 support level, previously a resistance during April’s consolidation phase, signals a bullish sentiment in the market. This recovery, combined with the presence of the 20-period Simple Moving Average (SMA) on the H4 chart, strengthens the positive outlook for Gold.
XAU/USD – H1 chart
The 200 SMA Turns From Resistance into Support for AUD/USD
The AUD/USD pair experienced a notable increase last week, driven by a risk-on sentiment following disappointing US inflation data. This upward movement carried the pair above the 200-day Simple Moving Average (SMA), which is a significant technical milestone. Currently, the level near 1.2650, corresponding to the 200-day SMA, serves as crucial support for the pair, which means that it is a good place to look for AUD/USD longs during dips.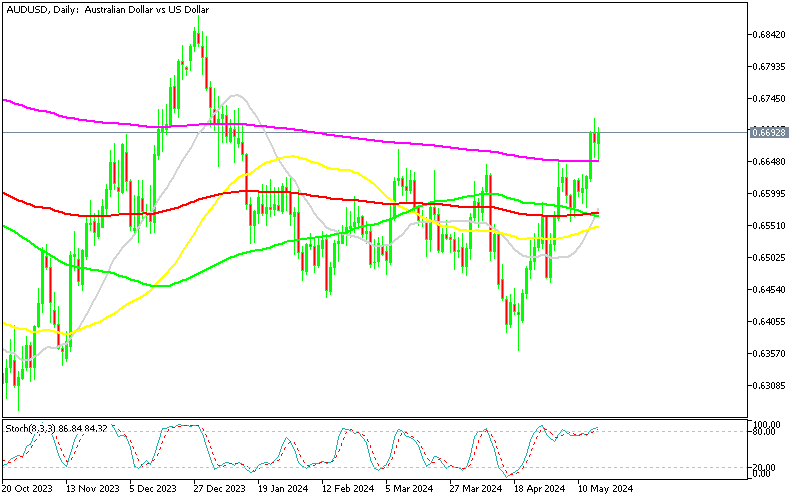
AUD/USD – Daily Chart
Cryptocurrency Update
Bitcoin Consolidates Above the 50 Daily SMA After the Jump
BITCOIN was exhibiting a pattern of lower highs since March, suggesting a potential shift towards a downtrend or consolidation phase. However, this pattern appears to have been disrupted by last week’s upward movement. The recent dip in Bitcoin’s price to around $61,000 has provided an opportunity for investors to enter the market after the 100 SMA (green) turned into support, as evidenced by our own position. While technical indicators such as the 50-day and 20-day Simple Moving Averages (SMAs) were acting as resistance, impeding Bitcoin’s upward momentum, they have been broken now and the 50-day moving average will likely turn into support on the daily chart.
BTC/USD – Daily chart
The 100 SMA Turns into Resistance for Ethereum
Ethereum (ETH) has experienced volatility in its price, with fluctuations causing it to dip below $3,000 multiple times before recovering. Despite these fluctuations, Ethereum has demonstrated resilience by frequently rebounding and surpassing the $3,000 mark. This resilience underscores the presence of strong support levels below $3,000, which have aided Ethereum in recovering from downturns. However the 100 SMA (green) has turned into resistance, limiting the gains after ETH experienced another bounce off the support zone last week.
ETH/USD – Daily chart
- Check out our free forex signals
- Follow the top economic events on FX Leaders economic calendar
- Trade better, discover more Forex Trading Strategies
- Open a FREE Trading Account
- Read our latest reviews on: Avatrade, Exness, HFM and XM
Related Articles


Sidebar rates
Related Posts
