Forex Signals Brief January 6: Forex Traders Are Back at Work, Starting 2025 with Inflation Data
The USD made considerable gains against most major currencies in 2024, particularly in Q4, and it already started 2025 on a great footing.

The USD made considerable gains against most major currencies in 2024, particularly in Q4, and it already started 2025 on a great footing.

The U.S. economy showed robust growth throughout 2024, driven by a broad expansion in the service sector and a resurgence in manufacturing activity, which reached its highest levels since May 2022. Gold and silver saw strong demand over the year, with prices rising more than 30%, despite a pullback in the final two months. The financial markets were significantly influenced by two key events: a dovish shift from major central banks and Donald Trump’s presidential victory.
These developments bolstered the U.S. dollar, particularly as the Federal Reserve ended the year less dovish than anticipated, scaling back expectations for aggressive monetary easing in 2025. Equity markets had a stellar year, especially in the United States. Key indices like the S&P 500 and Nasdaq repeatedly hit record highs, supported by the strong performance of major tech stocks, underscoring investor confidence and favorable market conditions.
This Week’s Market Expectations
Last week started with an assault from USD bulls, which made some strong gains until Friday, so 2024 ended up being a great year for USD buyers. The first week of 2025 begins with inflation data releases from various countries, providing insights into global economic trends.
However, the primary focus will be on the U.S. and Canadian employment reports scheduled for release on Friday. U.S. nonfarm payrolls are projected to show an increase of 154,000 jobs, a slowdown compared to the previous month’s 227,000. The unemployment rate is expected to remain steady at 4.2%. In Canada, employment is anticipated to rise by 24,500 jobs, down from last month’s 50,500 increase, with the unemployment rate forecasted to stay unchanged at 6.8%. These labor market reports will play a crucial role in shaping expectations for economic resilience and future central bank policies in the coming year.
Key Economic Events: Upcoming Week
Monday
- China: Caixin Services PMI – A gauge of service sector activity and economic recovery.
- Germany: CPI Inflation – Provides insights into consumer price trends in Europe’s largest economy.
- Canada: Services PMI – A measure of business activity in Canada’s services sector.
Tuesday
- Switzerland: CPI – A key indicator of inflationary trends in the Swiss economy.
- France: CPI – Tracks changes in consumer prices, offering insights into inflation pressures.
- Eurozone: CPI – Provides an overview of inflation across member states, influencing ECB policy.
- US: ISM Services PMI – Reflects the performance of the U.S. services sector, a major economic driver.
- US: Job Openings (JOLTS) – Key labor market data showing job availability and economic strength.
Wednesday
- Australia: Monthly CPI – A snapshot of inflation trends in the Australian economy.
- Eurozone: PPI – Tracks changes in producer prices, signaling potential inflationary pressure.
- US: ADP Employment Report – A preview of private sector job growth ahead of the NFP release.
- US: FOMC Minutes – Insights into the Federal Reserve’s policy deliberations and economic outlook.
Thursday
- Japan: Average Cash Earnings – Indicates wage growth and its impact on consumer spending.
- Eurozone: Retail Sales – Reflects consumer spending trends across member nations.
- US: NFIB Small Business Optimism Index – Gauges sentiment among small business owners.
- US: Weekly Jobless Claims – A barometer of short-term labor market health.
Friday
- Switzerland: Unemployment Rate – A measure of labor market stability.
- Canada: Employment Report – Tracks job creation and unemployment, key for economic momentum.
- US: Nonfarm Payrolls (NFP) – The week’s highlight, indicating overall employment health in the U.S.
- US: University of Michigan Consumer Sentiment – A measure of consumer confidence and spending outlook.
Last week most markets were closed and the vast majority of traders were on holiday, but the volatility was high due to thin liquidity and year-end cash flows. As a result we opened many trading signals, 36 trades in total, ending up with only 6 losing trades, while the rest were all winning forex signals, giving us a great win/loss ratio, which was the case for all 2024.
Gold Rejected by the 50 Daily SMA
Gold prices continue to reflect shifting expectations for monetary policy. After failing to break the key $2,725 resistance level, prices dropped $100 last week. This decline was driven by strong U.S. services PMI data and expectations of a Federal Reserve rate cut, both of which amplified bearish sentiment. The downward momentum intensified when gold fell below its 100-day Simple Moving Average (SMA), which then acted as a resistance level, thwarting multiple recovery attempts, including one on Friday. Despite ongoing selling pressure pushing gold below $2,600, prices have since reversed higher. XAU/USD is currently testing the 50-day SMA (yellow) and has managed to climb above the 100-day SMA (green).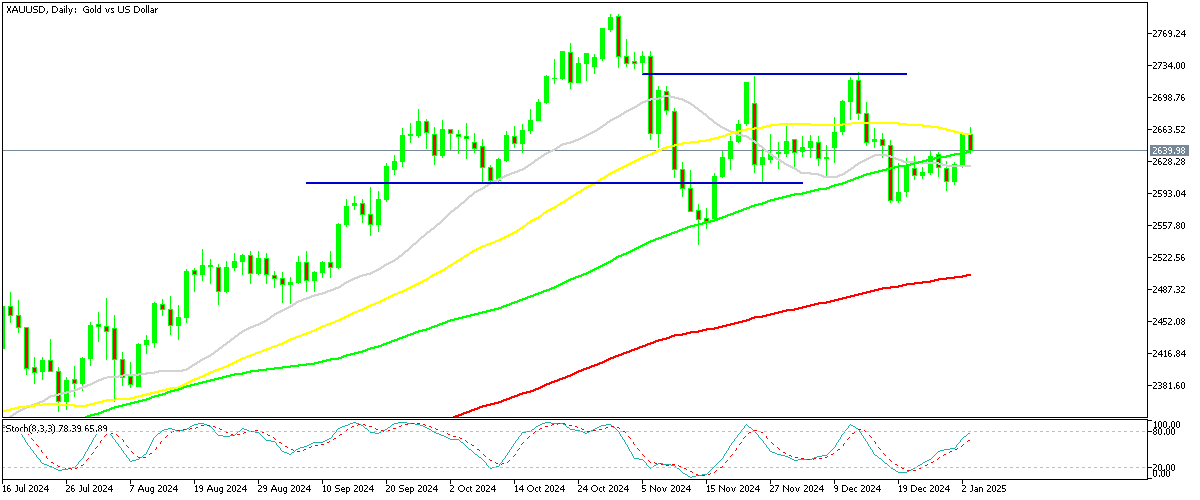
XAU/USD – Daily Chart
EUR/USD Faces the 50 SMA After Climbing Above 1.03
In the forex market, EUR/USD, which had established a base around 1.0330-50 in November following a hawkish Fed rate drop, saw that support hold through December. However, the final days of 2024 were notably bearish for the Euro and bullish for the U.S. dollar. This led to a 2-cent decline in EUR/USD, breaching key support levels and paving the way toward parity at 1.00. Sellers continue to dominate the market, prompting a strategy of selling upward retraces in EUR/USD.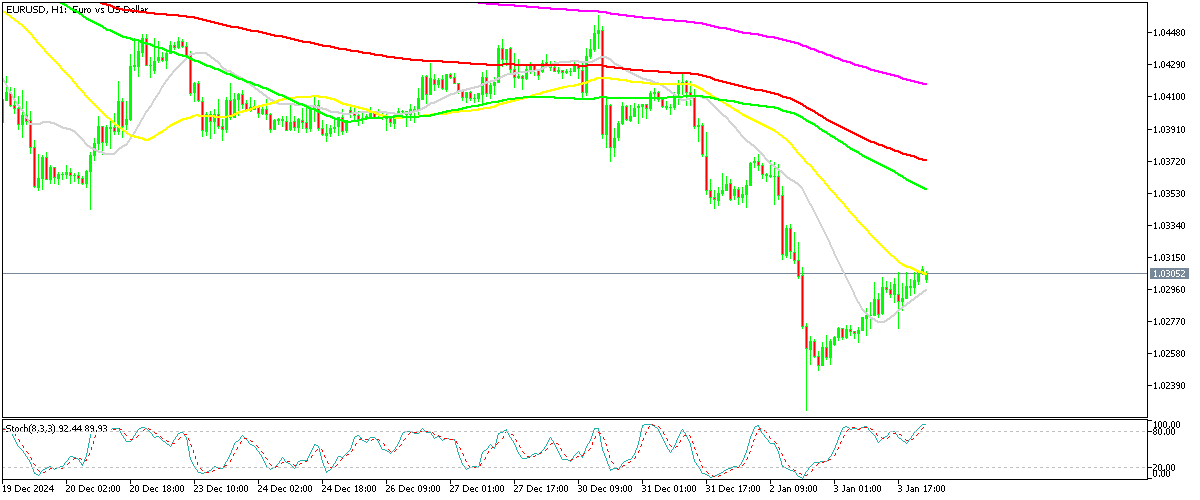
EUR/USD – Daily Chart
Cryptocurrency Update
Bitcoin Heads for $100K After Bouncing Off the $90K Support

BTC/USD – Daily chart
Ethereum Heads Toward $3,500 Again
Ethereum also saw substantial volatility, rising from $3,000 to nearly $4,000 midweek. Despite this strong start, ETH struggled to sustain levels above $4,000. Losses deepened as the price fell below $3,500, but in the last two weeks, Ethereum has rebounded. The 50-day SMA (yellow) has provided solid support, helping ETH stabilize and recover some of its lost ground.
ETH/USD – Weekly Chart
- Check out our free forex signals
- Follow the top economic events on FX Leaders economic calendar
- Trade better, discover more Forex Trading Strategies
- Open a FREE Trading Account
- Read our latest reviews on: Avatrade, Exness, HFM and XM
Related Articles


Sidebar rates
Related Posts
