Gold Price Analysis: $2,644 Gains Amid U.S. Rate Speculation
Gold prices edged higher on Tuesday, trading at $2,643.98, up 0.19%, as traders awaited critical U.S. economic data to assess...

Gold prices edged higher on Tuesday, trading at $2,643.98, up 0.19%, as traders awaited critical U.S. economic data to assess the Federal Reserve’s 2025 rate strategy.

A solid U.S. jobs report, set for release Friday, will play a pivotal role in shaping market expectations for rate cuts. Stable unemployment at 4.2% may lead to a more measured easing trajectory, keeping gold within a tight trading range.
Treasury yields hit their highest levels since May 2024 on Monday, reflecting uncertainty over President-elect Donald Trump’s proposed tariffs. Meanwhile, the minutes from the Fed’s December meeting, due Wednesday, will offer insights into policymakers’ concerns over persistent inflation. Fed Governor Lisa Cook emphasized a cautious approach to rate cuts amid an economy proving more resilient than expected.
As a hedge against inflation, gold has historically benefited from accommodative monetary policy. However, with high interest rates diminishing bullion’s appeal, investors are closely watching inflation and employment data for clues.
Economic Data to Guide Gold’s Path
Key events include Tuesday’s job openings report and Wednesday’s ADP employment numbers. While non-farm payrolls on Friday remain the focal point, the market is increasingly wary of sticky inflation reigniting caution among Fed officials.
-
Bullion’s Appeal Amid Uncertainty: Elevated rates reduce gold’s attractiveness, yet persistent inflation may reignite investor interest in the yellow metal.
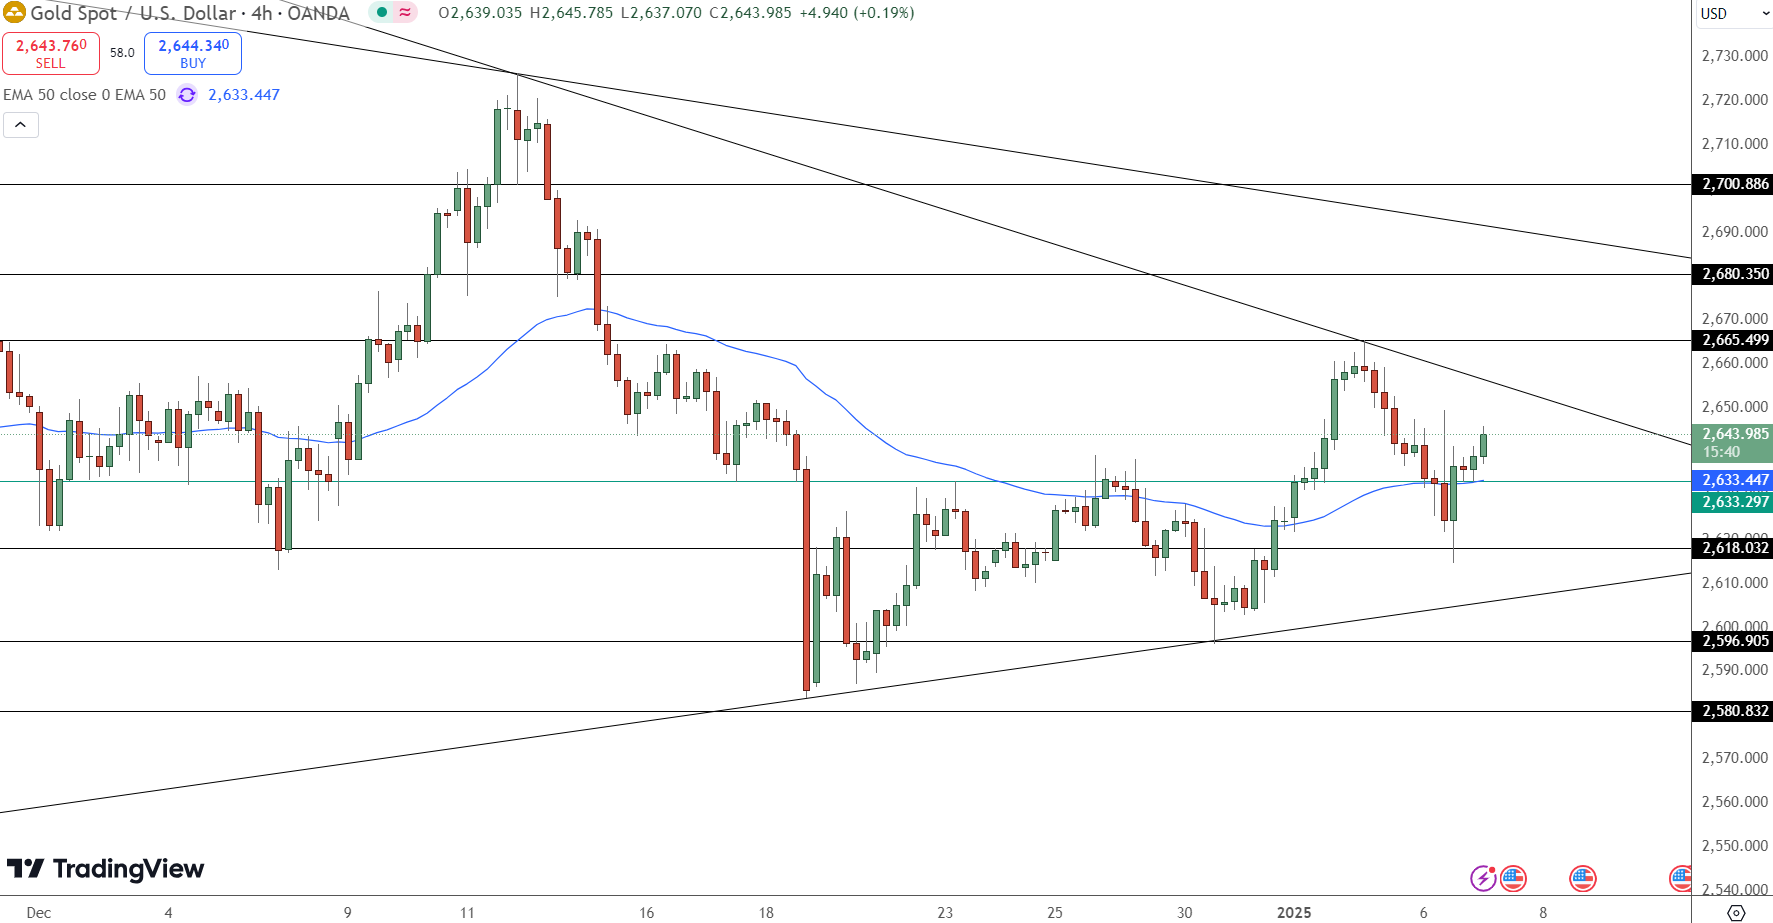
Gold Technical Analysis
Gold consolidates within a symmetrical triangle on the 4-hour chart, signaling potential volatility ahead. Immediate resistance is at $2,665.50, with further targets at $2,680.35 and $2,700.88. On the downside, support stands at $2,633.30, followed by $2,618.03 and $2,596.91.
-
The 50-day EMA at $2,633.45 serves as immediate support.
-
RSI at 58 indicates moderate bullish momentum.
A breakout above $2,665.50 may trigger a bullish rally, while a drop below $2,633.30 could lead to a bearish pullback.
- Check out our free forex signals
- Follow the top economic events on FX Leaders economic calendar
- Trade better, discover more Forex Trading Strategies
- Open a FREE Trading Account
- Read our latest reviews on: Avatrade, Exness, HFM and XM
Related Articles


Sidebar rates
Related Posts
