IonQ Stock Surges 780% in Just Six Months: Key Levels and Trends

IonQ Inc. (NASDAQ: IONQ) is a leading quantum computing company specializing in developing general-purpose quantum systems.While IonQ has secured significant contracts, such as the largest U.S. quantum contract for 2024 with the Air Force for $54.5 million, the company’s stock has seen incredible growth.
IONQ Stock Surges By 780 % In Six Months
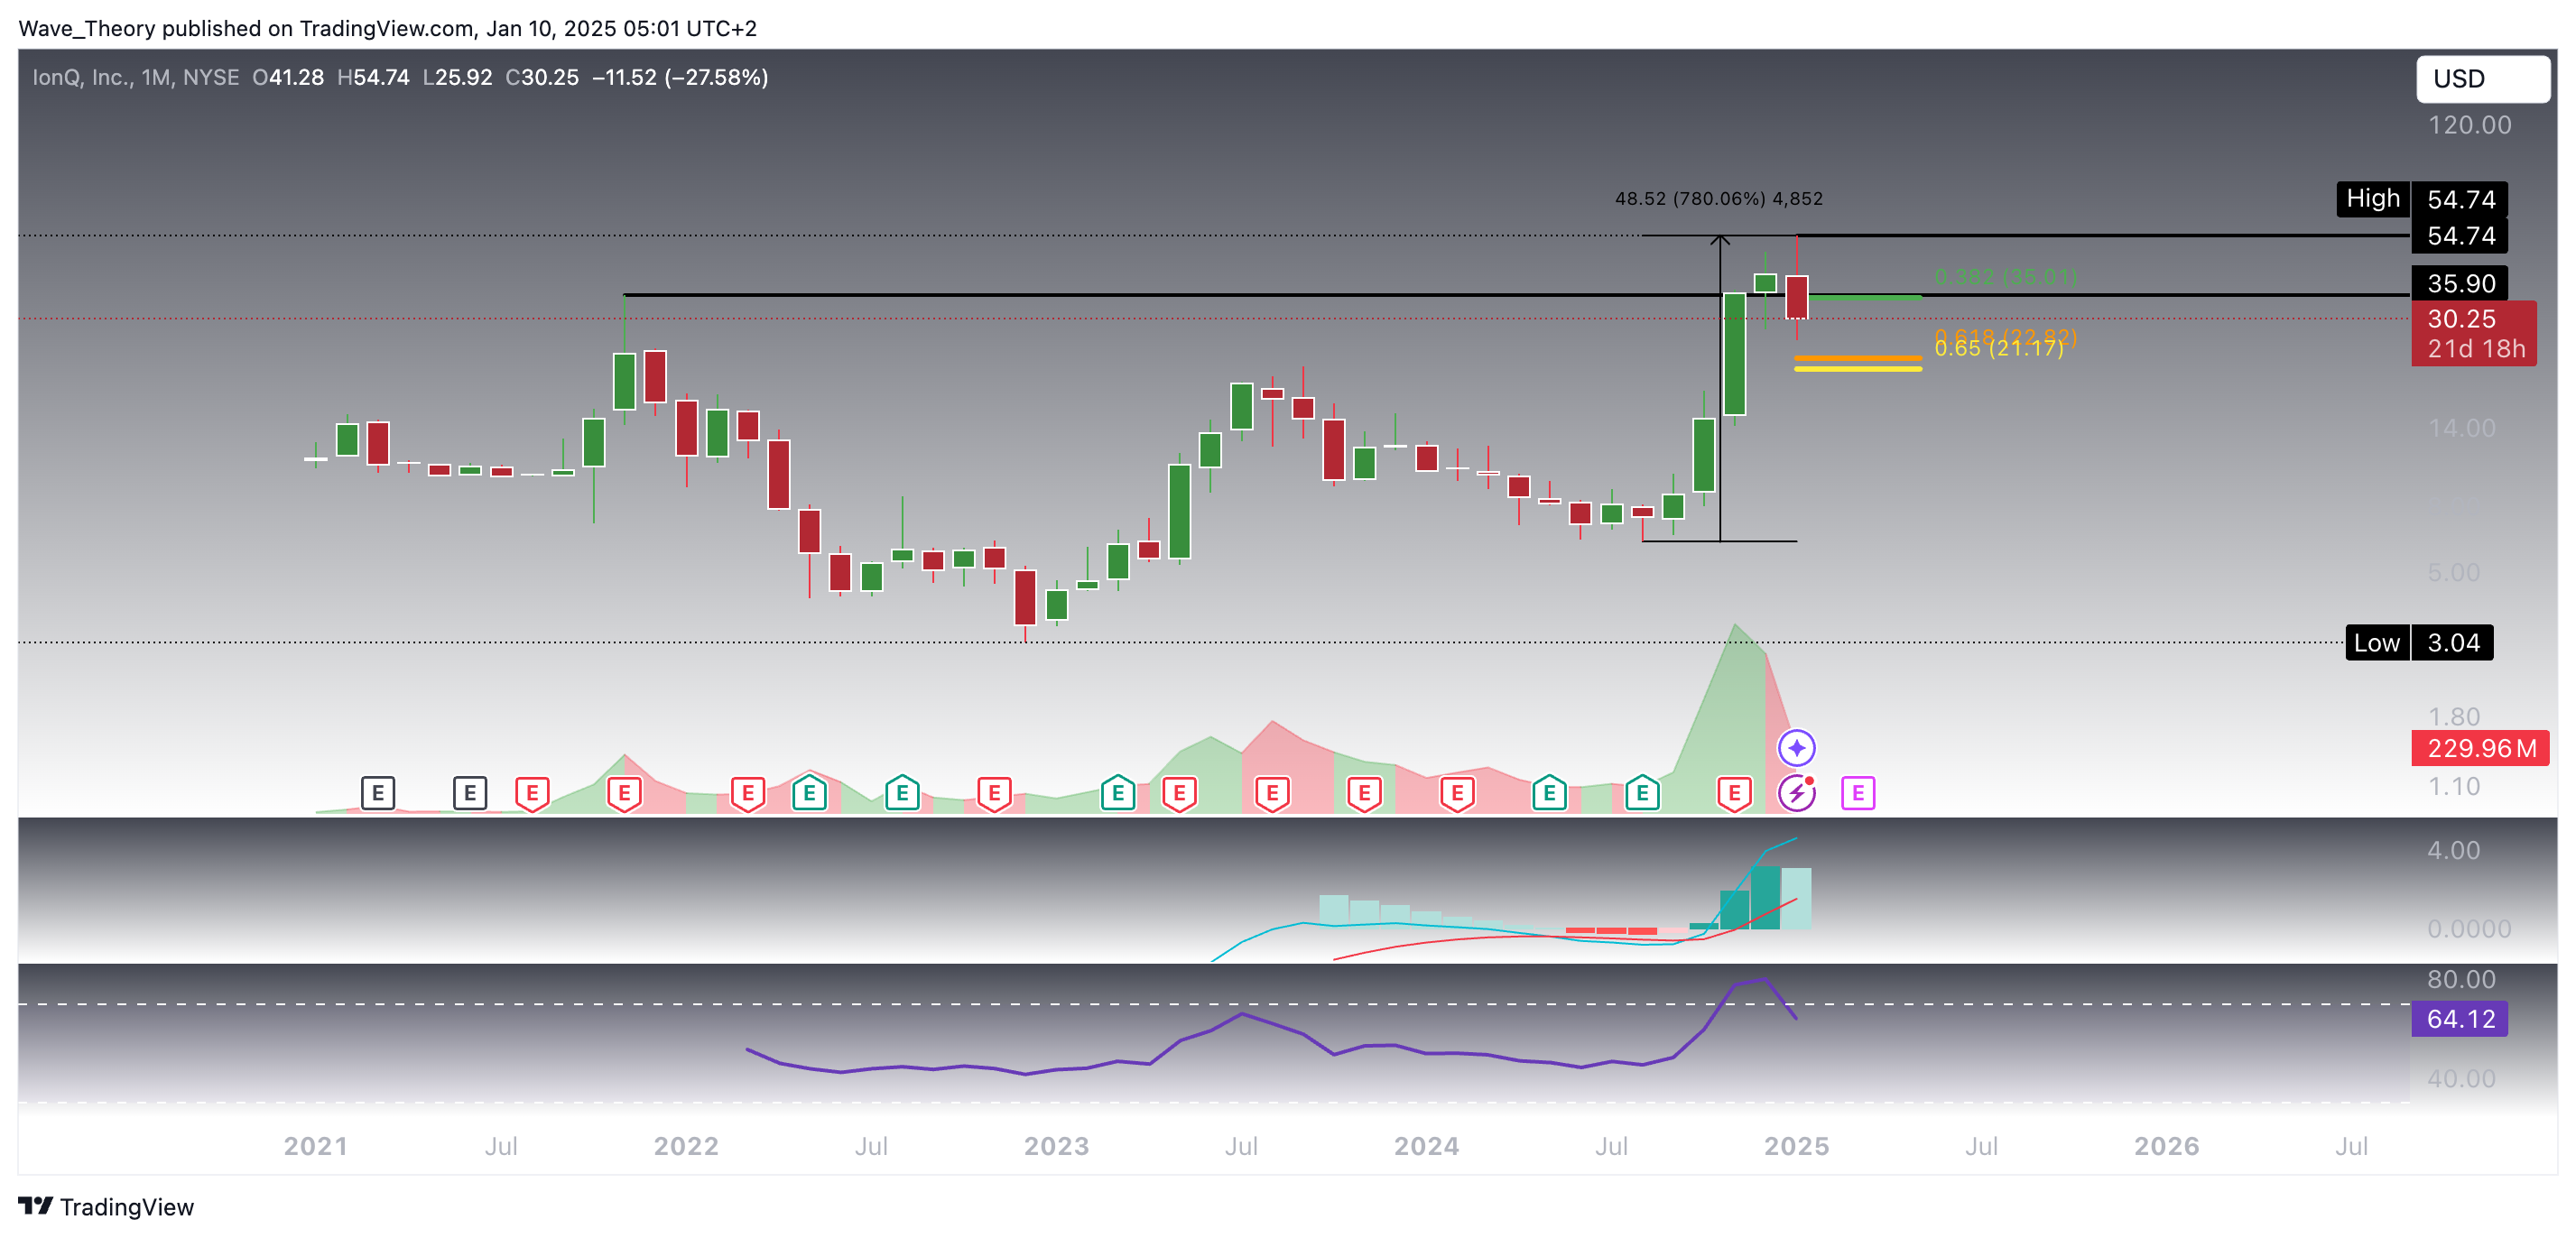
In just six months, IONQ has skyrocketed by over 780%, surpassing its previous all-time high (ATH) of $35.9 and establishing a new peak at $54.74. However, since reaching this high, the stock has undergone a sharp correction, breaking below the 0.382 Fibonacci retracement level at $35. Should the decline persist, IONQ could potentially test the golden ratio support at $22, a critical level to watch for further downside.
The technical indicators support this bearish outlook. The MACD histogram has started to tick downward, signaling increasing bearish momentum on the monthly chart. Additionally, the RSI has exited overbought territory and is now in neutral, suggesting the bullish momentum is fading. Although the MACD lines have yet to cross into a bearish signal, the setup points to continued pressure on the stock, with the potential for deeper corrections ahead.
Golden Crossover Has Emerged On The Weekly Chart
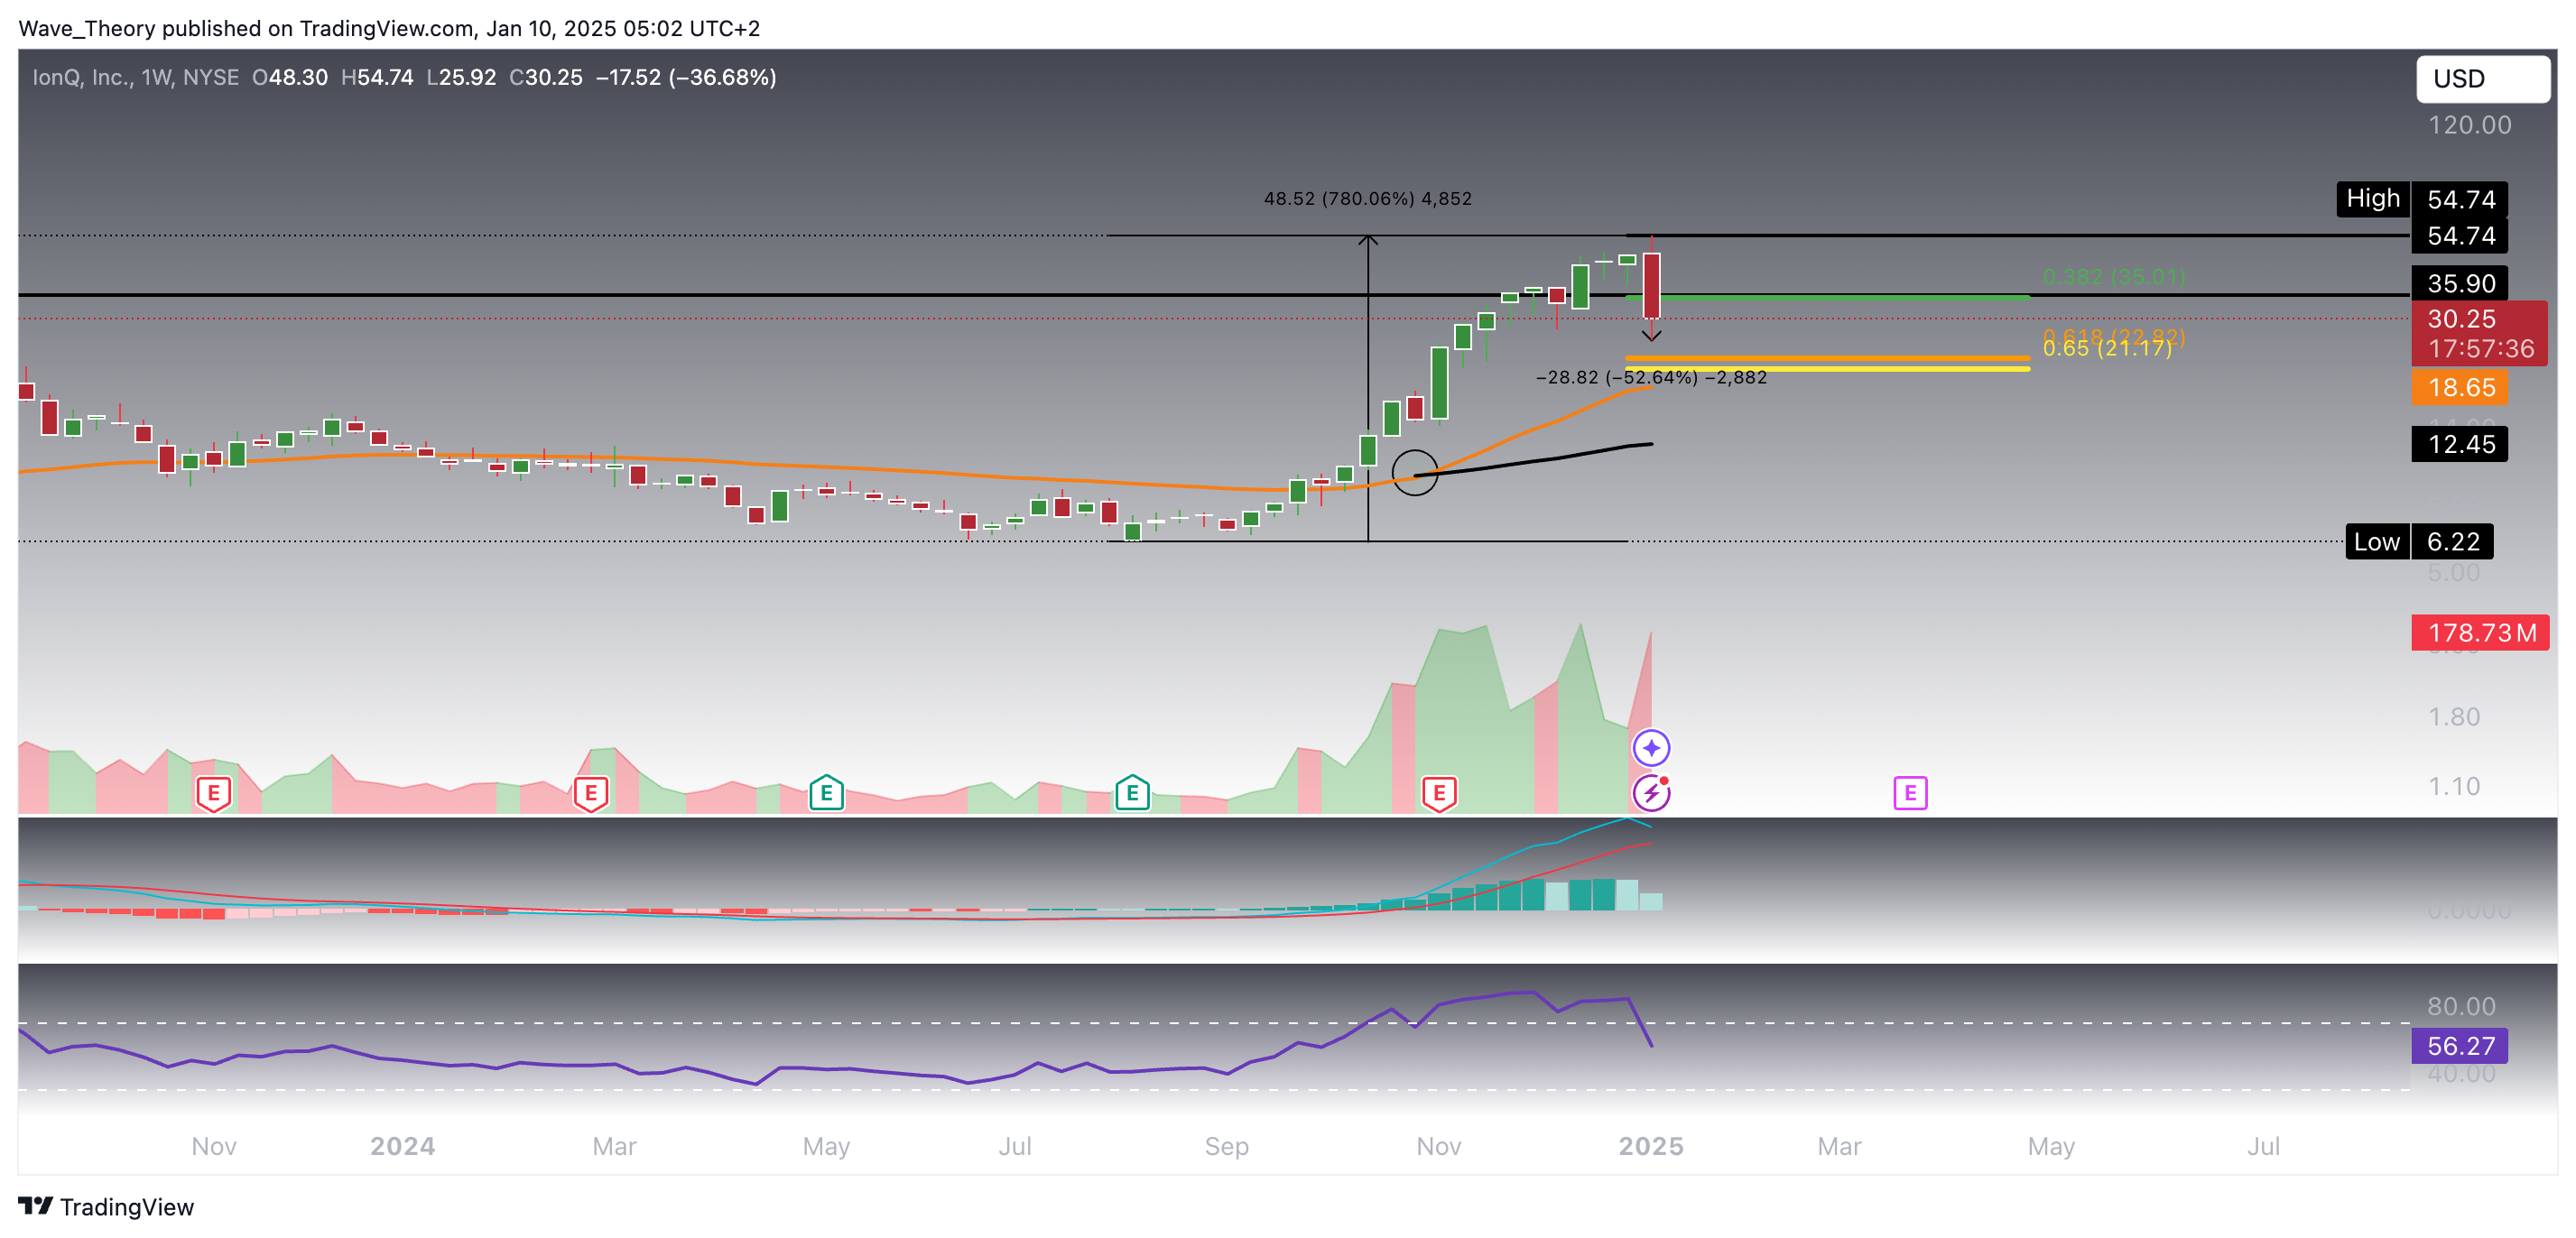
On the weekly chart, the EMAs have confirmed a golden crossover, indicating a bullish trend in the mid-term. However, despite this bullish signal, this week has been decisively bearish, with IONQ dropping by over 52.6%, which increases the likelihood of further declines. Should the downtrend continue, IONQ is poised to test the golden ratio support at $22, a crucial level that could determine the stock’s next move.
Further reinforcing the bearish sentiment, the MACD histogram has been ticking lower for the past two weeks, with the MACD lines nearing a potential bearish crossover. The RSI, meanwhile, has entered neutral territory, offering no clear directional bias, as it neither signals overbought nor oversold conditions. This neutral stance suggests the market is indecisive, leaving room for both further downside or potential consolidation.
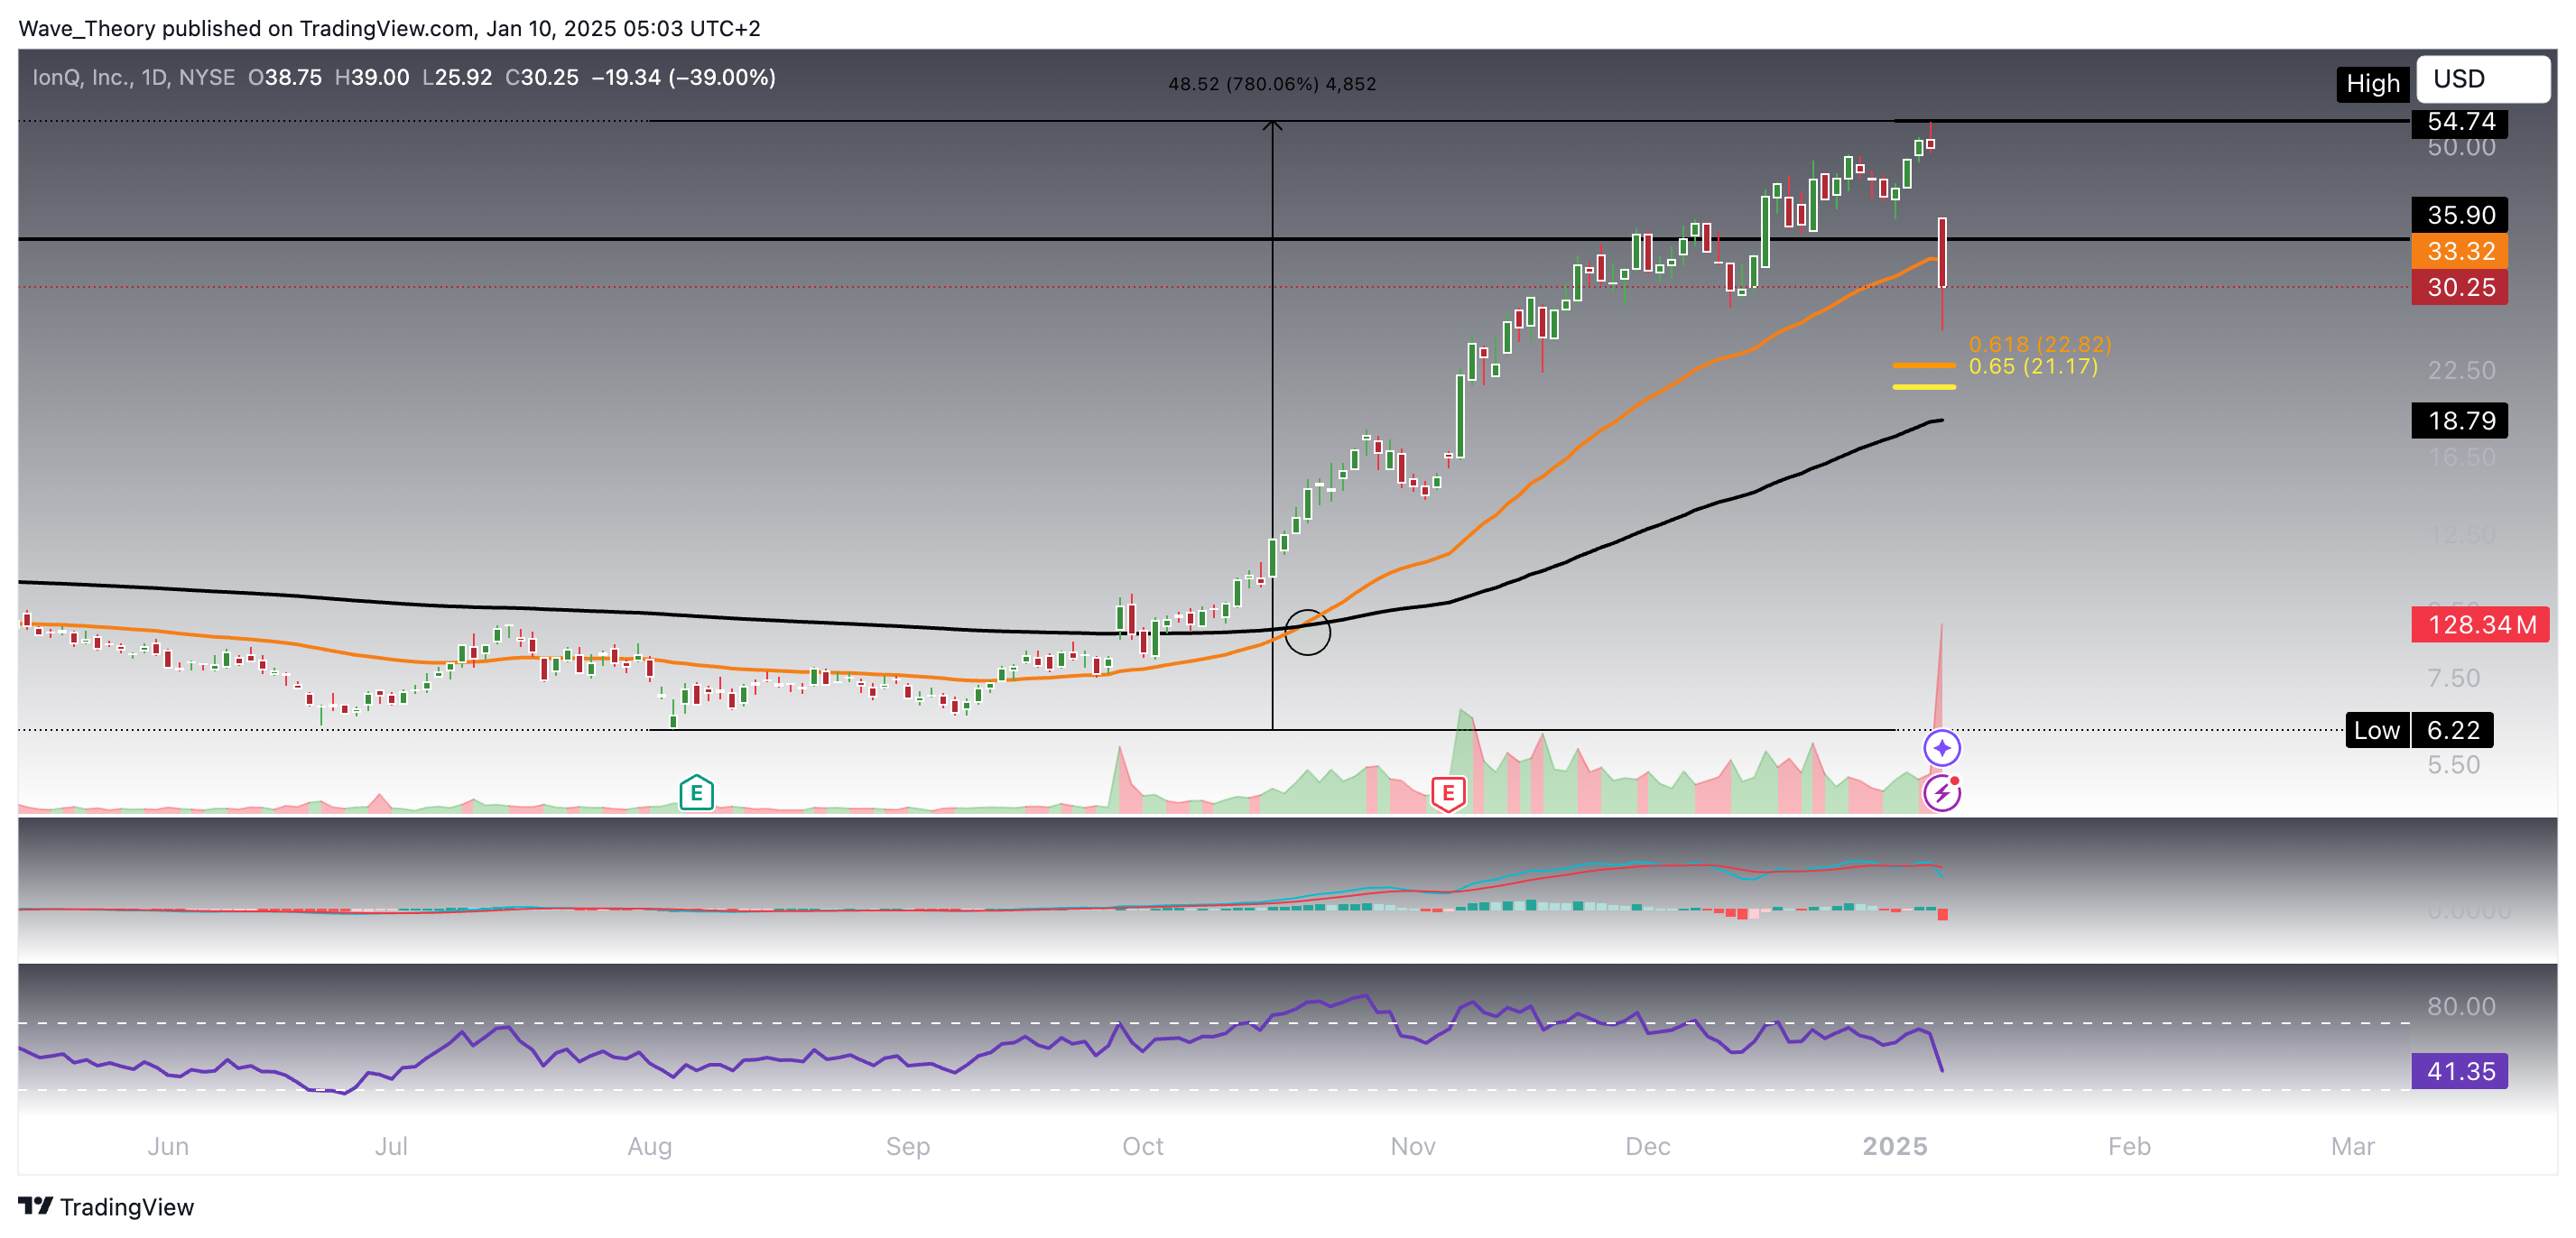
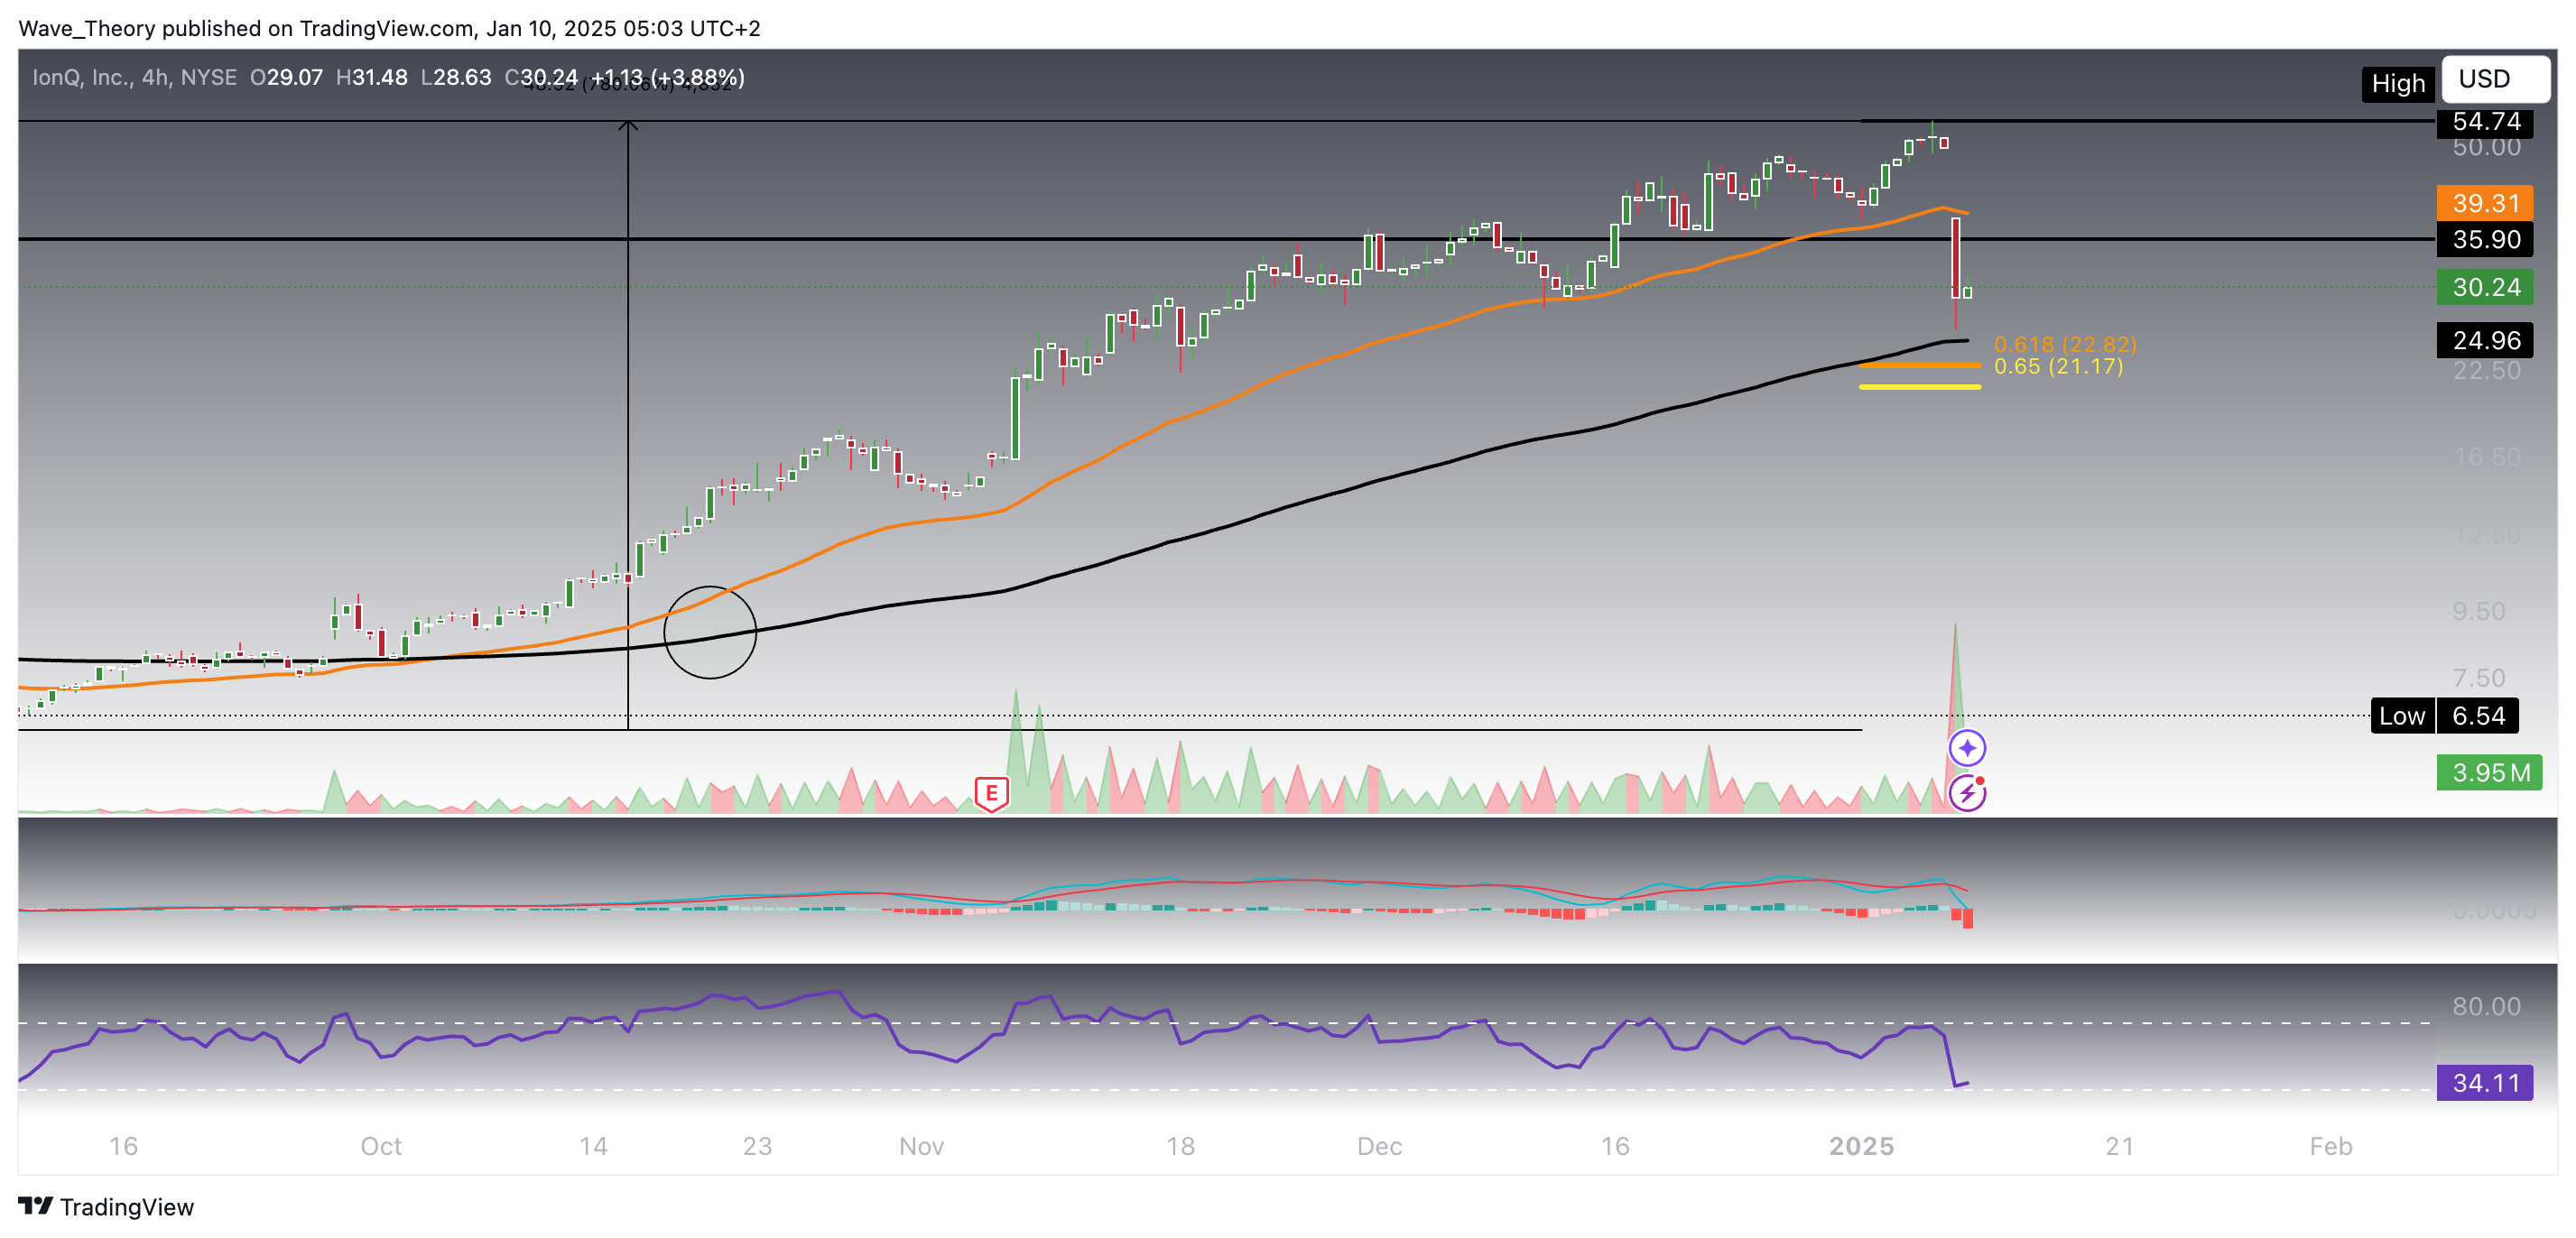
On the 4H chart, the technical setup closely mirrors the daily chart. The EMAs have formed a golden crossover, confirming a bullish trend, but the MACD remains bearish, with the lines already crossed downward and the histogram signaling continued selling pressure. The RSI is hovering near oversold territory, suggesting that a rebound may be imminent if the stock can find support.
The 200-4H EMA provides additional support at $25, creating a strong support zone between $18 and $25, where IonQ could potentially stage a bullish bounce to resume its uptrend. However, the stock faces significant resistance between $35.9 and $54.74, levels that must be cleared for the continuation of its bullish momentum. This region will be critical to monitor for any breakout attempts.
- Check out our free forex signals
- Follow the top economic events on FX Leaders economic calendar
- Trade better, discover more Forex Trading Strategies
- Open a FREE Trading Account
- Read our latest reviews on: Avatrade, Exness, HFM and XM
Related Articles


Sidebar rates
Related Posts
