Chainlink Price Analysis: Potential Breakout Despite Recent Market Correction
Chainlink (LINK) displays signs of a potential breakout as technical analysts and market watchers point to various positive signals that
Chainlink (LINK) displays signs of a potential breakout as technical analysts and market watchers point to various positive signals that might drive the LINK/USD price higher in the next weeks, therefore indicating a notable correction to start 2025.
Chainlink is currently trading at approximately $20, representing a 15% decline over the past seven days. However, this corrective move comes after a remarkable 43% gain over the past year, highlighting the token’s strong long-term performance despite short-term volatility.
Chainlink’s Strong Fundamentals
Chainlink’s fundamental outlook remains robust, supported by several key developments:
- Strategic Partnerships: The recent collaboration with Ripple to expand RLUSD stablecoin functionality demonstrates Chainlink’s growing influence in the DeFi ecosystem.
- Real World Asset (RWA) Integration: Chainlink continues to lead in providing critical infrastructure for tokenizing real-world assets, positioning itself at the forefront of this emerging trend.
- Institutional Adoption: Major financial institutions, including Swift and Euroclear, have acknowledged Chainlink’s role in bridging traditional finance with blockchain technology.
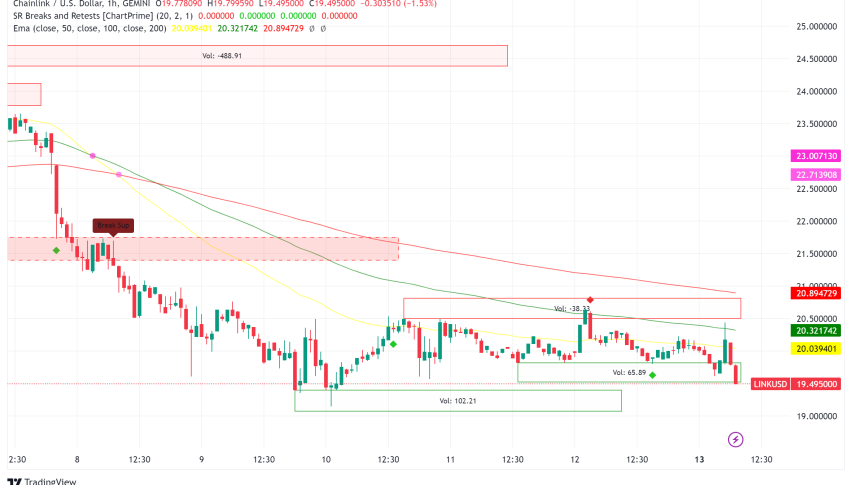
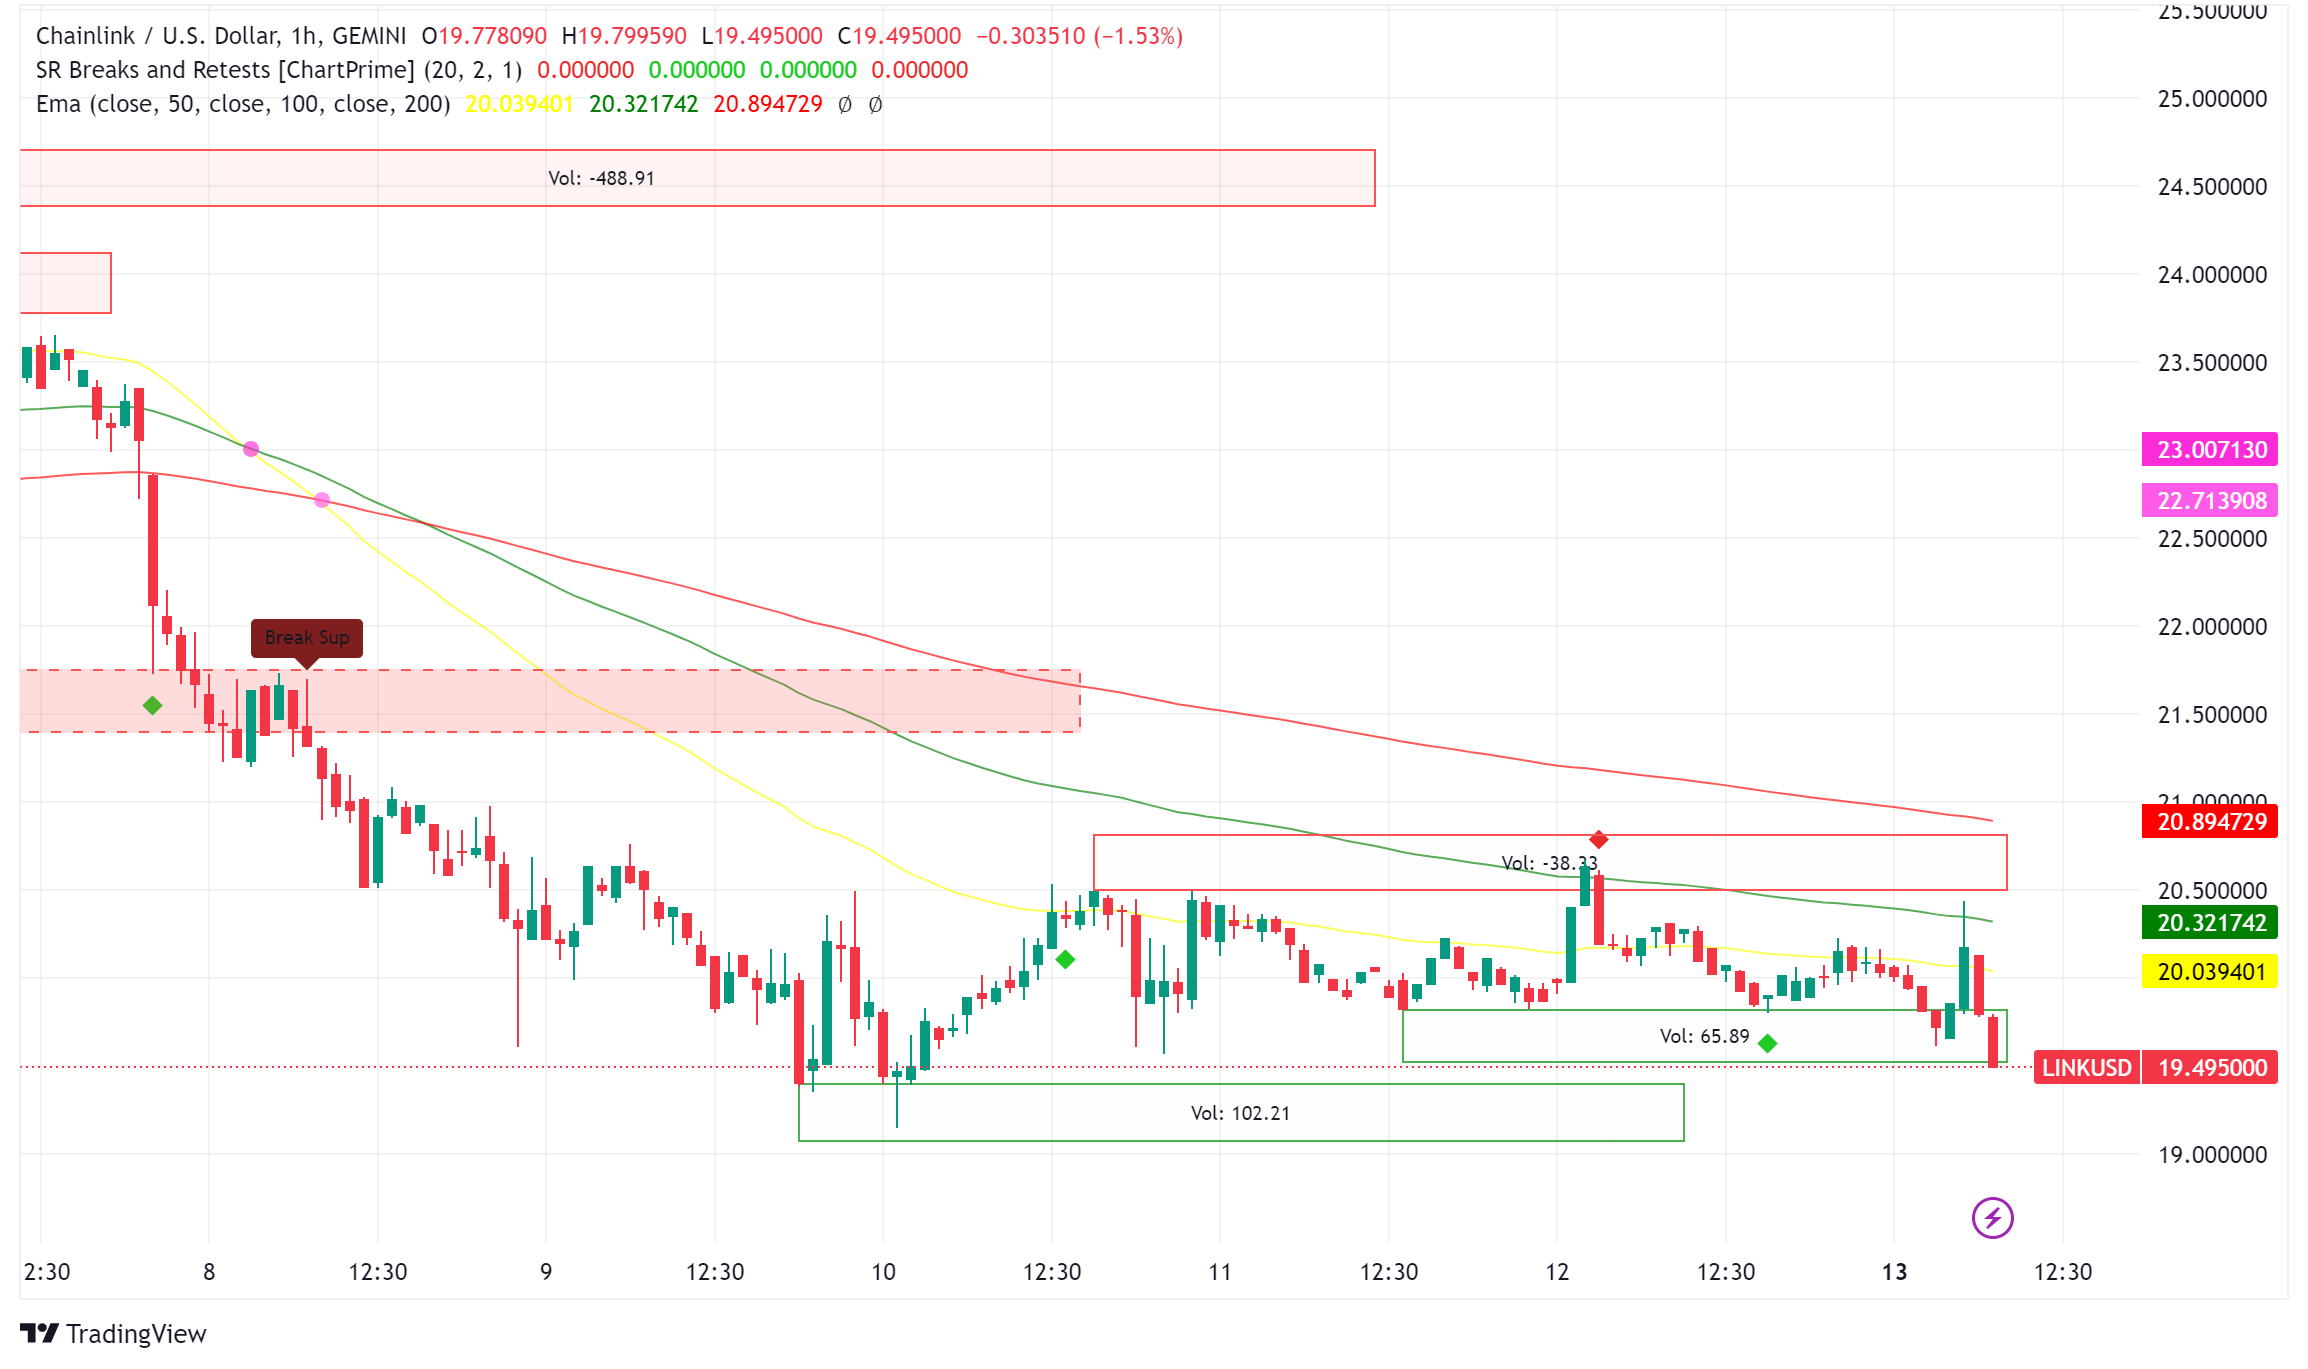
LINK/USD Technical Analysis
The daily chart reveals a compelling technical setup, with LINK forming a falling wedge pattern – typically considered a bullish reversal formation. Key technical levels to watch include:
Resistance Levels
- Primary: $21 (Middle Bollinger Band)
- Secondary: $25
- Major: $30
Support Levels
- Immediate: $18
- Secondary: $16
- Strong: $13.50
The Relative Strength Index (RSI) currently sits at 41, indicating bearish momentum but showing no immediate signs of oversold conditions. The Bollinger Bands suggest decreased volatility, with prices trading below the middle band, signaling continued downward momentum in the short term.
Chainlink Price Prediction
Analysts present varying price targets for LINK:
Short-term (January 2025)
- CoinCodex projects a maximum price of $27 (37% upside)
- Immediate resistance at $21 needs to be cleared for further upside
Medium-term (2025)
- Average projected price: $28.73
- Range: $17.45 – $49.04
- Potential for $25 by mid-2025
While the current market shows bearish sentiment in the short term, multiple analysts, including SherifDefi and Carl Runefelt, maintain bullish long-term outlooks. They point to LINK’s strong fundamentals and critical role in the DeFi ecosystem as key factors supporting future price appreciation.
- Check out our free forex signals
- Follow the top economic events on FX Leaders economic calendar
- Trade better, discover more Forex Trading Strategies
- Open a FREE Trading Account
- Read our latest reviews on: Avatrade, Exness, HFM and XM
Related Articles
Sidebar rates
Related Posts
