Ethereum Price Analysis: Technical Indicators Signal Potential Market Shift
Ethereum (ETH) finds itself at a critical juncture, trading around $3,200 as technical indicators paint a mixed picture of the crypto's near
Ethereum (ETH) finds itself at a critical juncture, trading around $3,200 as technical indicators paint a mixed picture of the cryptocurrency’s near-term trajectory.
The second-largest cryptocurrency by market capitalization, ETH/USD has experienced notable volatility, with prices declining more than 10% last week after failing to breach the $3,730 resistance level.
ETH Open Interest Recovery Notes Potential Rebound
Ethereum’s open interest indicator provides encouraging signals of recovery based on CryptoQuant analysis. Ethereum traders seem to be building positions close to the $3,000 support level, indicating rising belief in a possible price comeback.
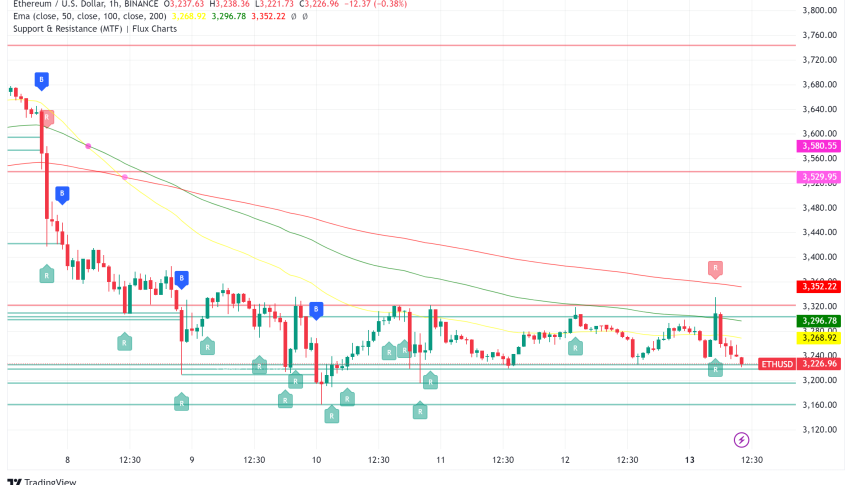
ETH/USD Technical Analysis Reveals Conflicting Signals
Current market data reveals a complex technical landscape. On the hourly chart, a bullish trend line has developed with support at $3,250; the MACD indicator shows mounting bearish momentum. Reading 40 on the daily chart, the RSI indicator below its neutral threshold of 50 indicates continuous negative pressure.
Historically a sign of accumulation stages by big investors or “whales,” the Market Value to Realized Value (MVRV) ratio shows oversold conditions. This statistic supports possible upward movement even more when combined with important support zones.
Key Support and Resistance Levels
Multiple analysts identify $3,207 as a crucial support level, with $3,000 serving as a psychological support threshold. On the upside, significant resistance levels are established at:
- $3,320 (immediate resistance)
- $3,450 (major resistance level)
- $3,730 (previous resistance level)
A clear break above $3,520 could catalyze further gains, potentially pushing ETH toward the $3,650 mark.
Long-term View Still Shows Optimism.
Some experts retain optimistic long-term forecasts despite present market volatility; price targets by Q1 2025 surpass $6,000. Technical configurations and an upward channel pattern support this projection; $2,800 is recognized as a main support level for continuous development.
Usually regarded as a bullish indication, market watchers note the development of an inverted head and shoulders pattern with a possible objective of $4,506. But immediate price action will probably rely on Ethereum’s capacity to keep support above $3,200 and effectively challenge the $3,320 resistance level.
- Check out our free forex signals
- Follow the top economic events on FX Leaders economic calendar
- Trade better, discover more Forex Trading Strategies
- Open a FREE Trading Account
- Read our latest reviews on: Avatrade, Exness, HFM and XM
Related Articles


Sidebar rates
Related Posts
