MicroStrategy Stock (MSTR) Breaks Important Support: More Downside To Come?

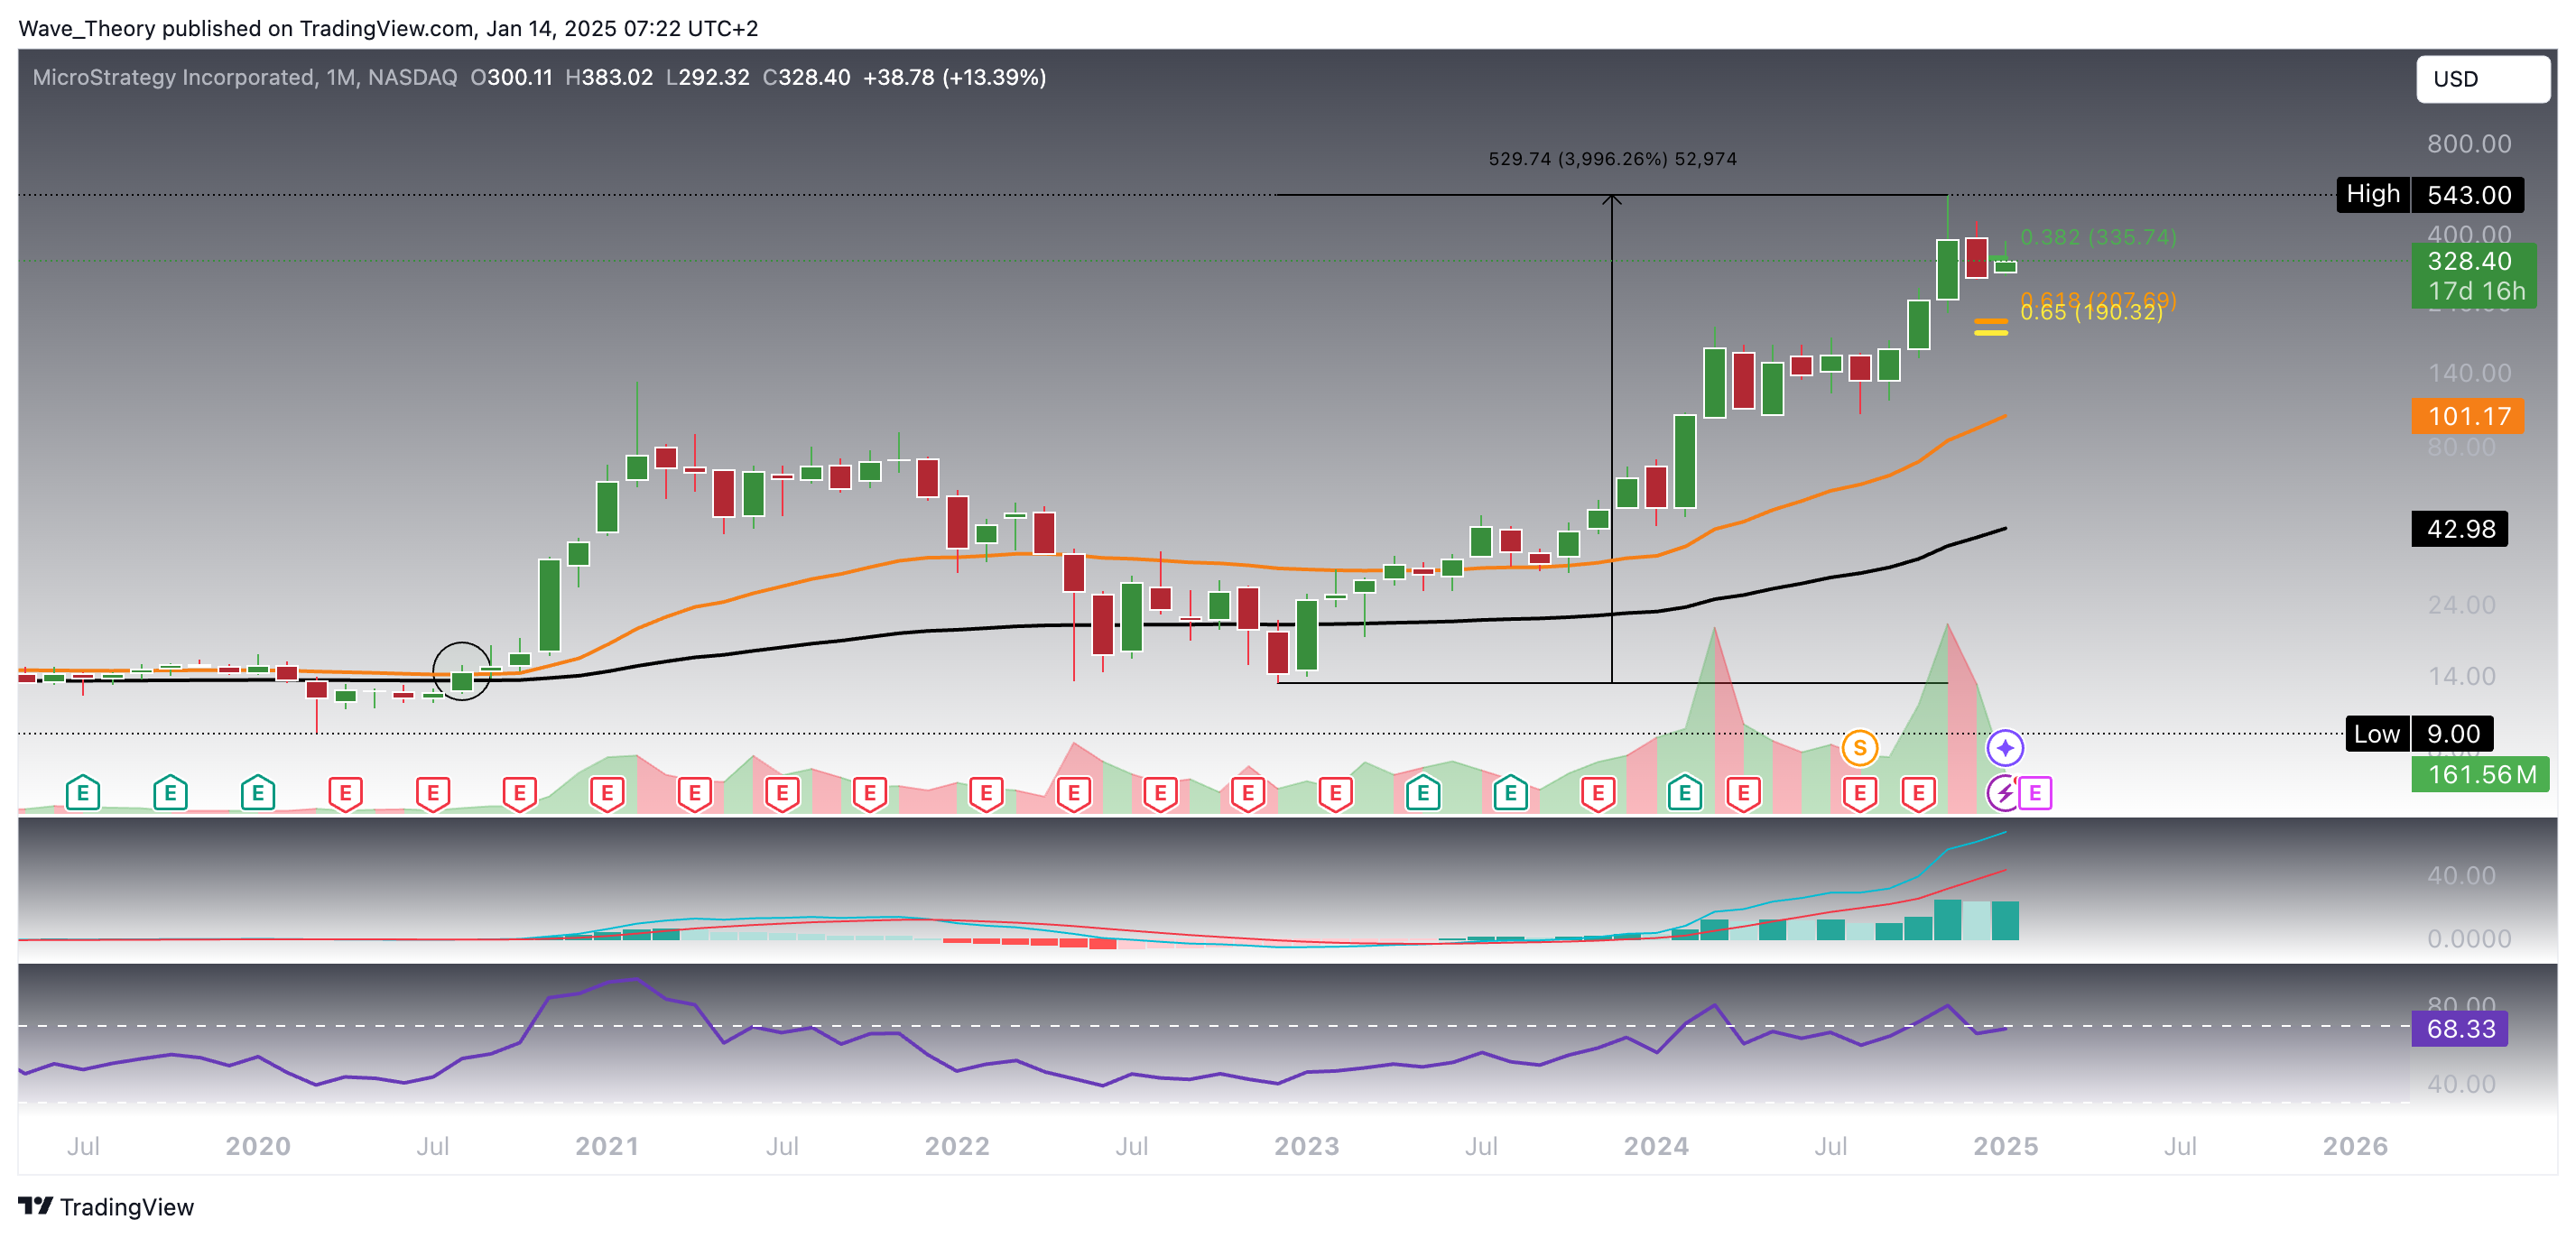
MicroStrategy has experienced an extraordinary rally, surging nearly 4,000% over the past two years, driven primarily by its aggressive Bitcoin holdings and bullish sentiment around the cryptocurrency market. After reaching an all-time high (ATH) at $543, the stock has since undergone a significant correction.
MicroStrategy (MSTR) Breaks 0.382 Fib Level At $335
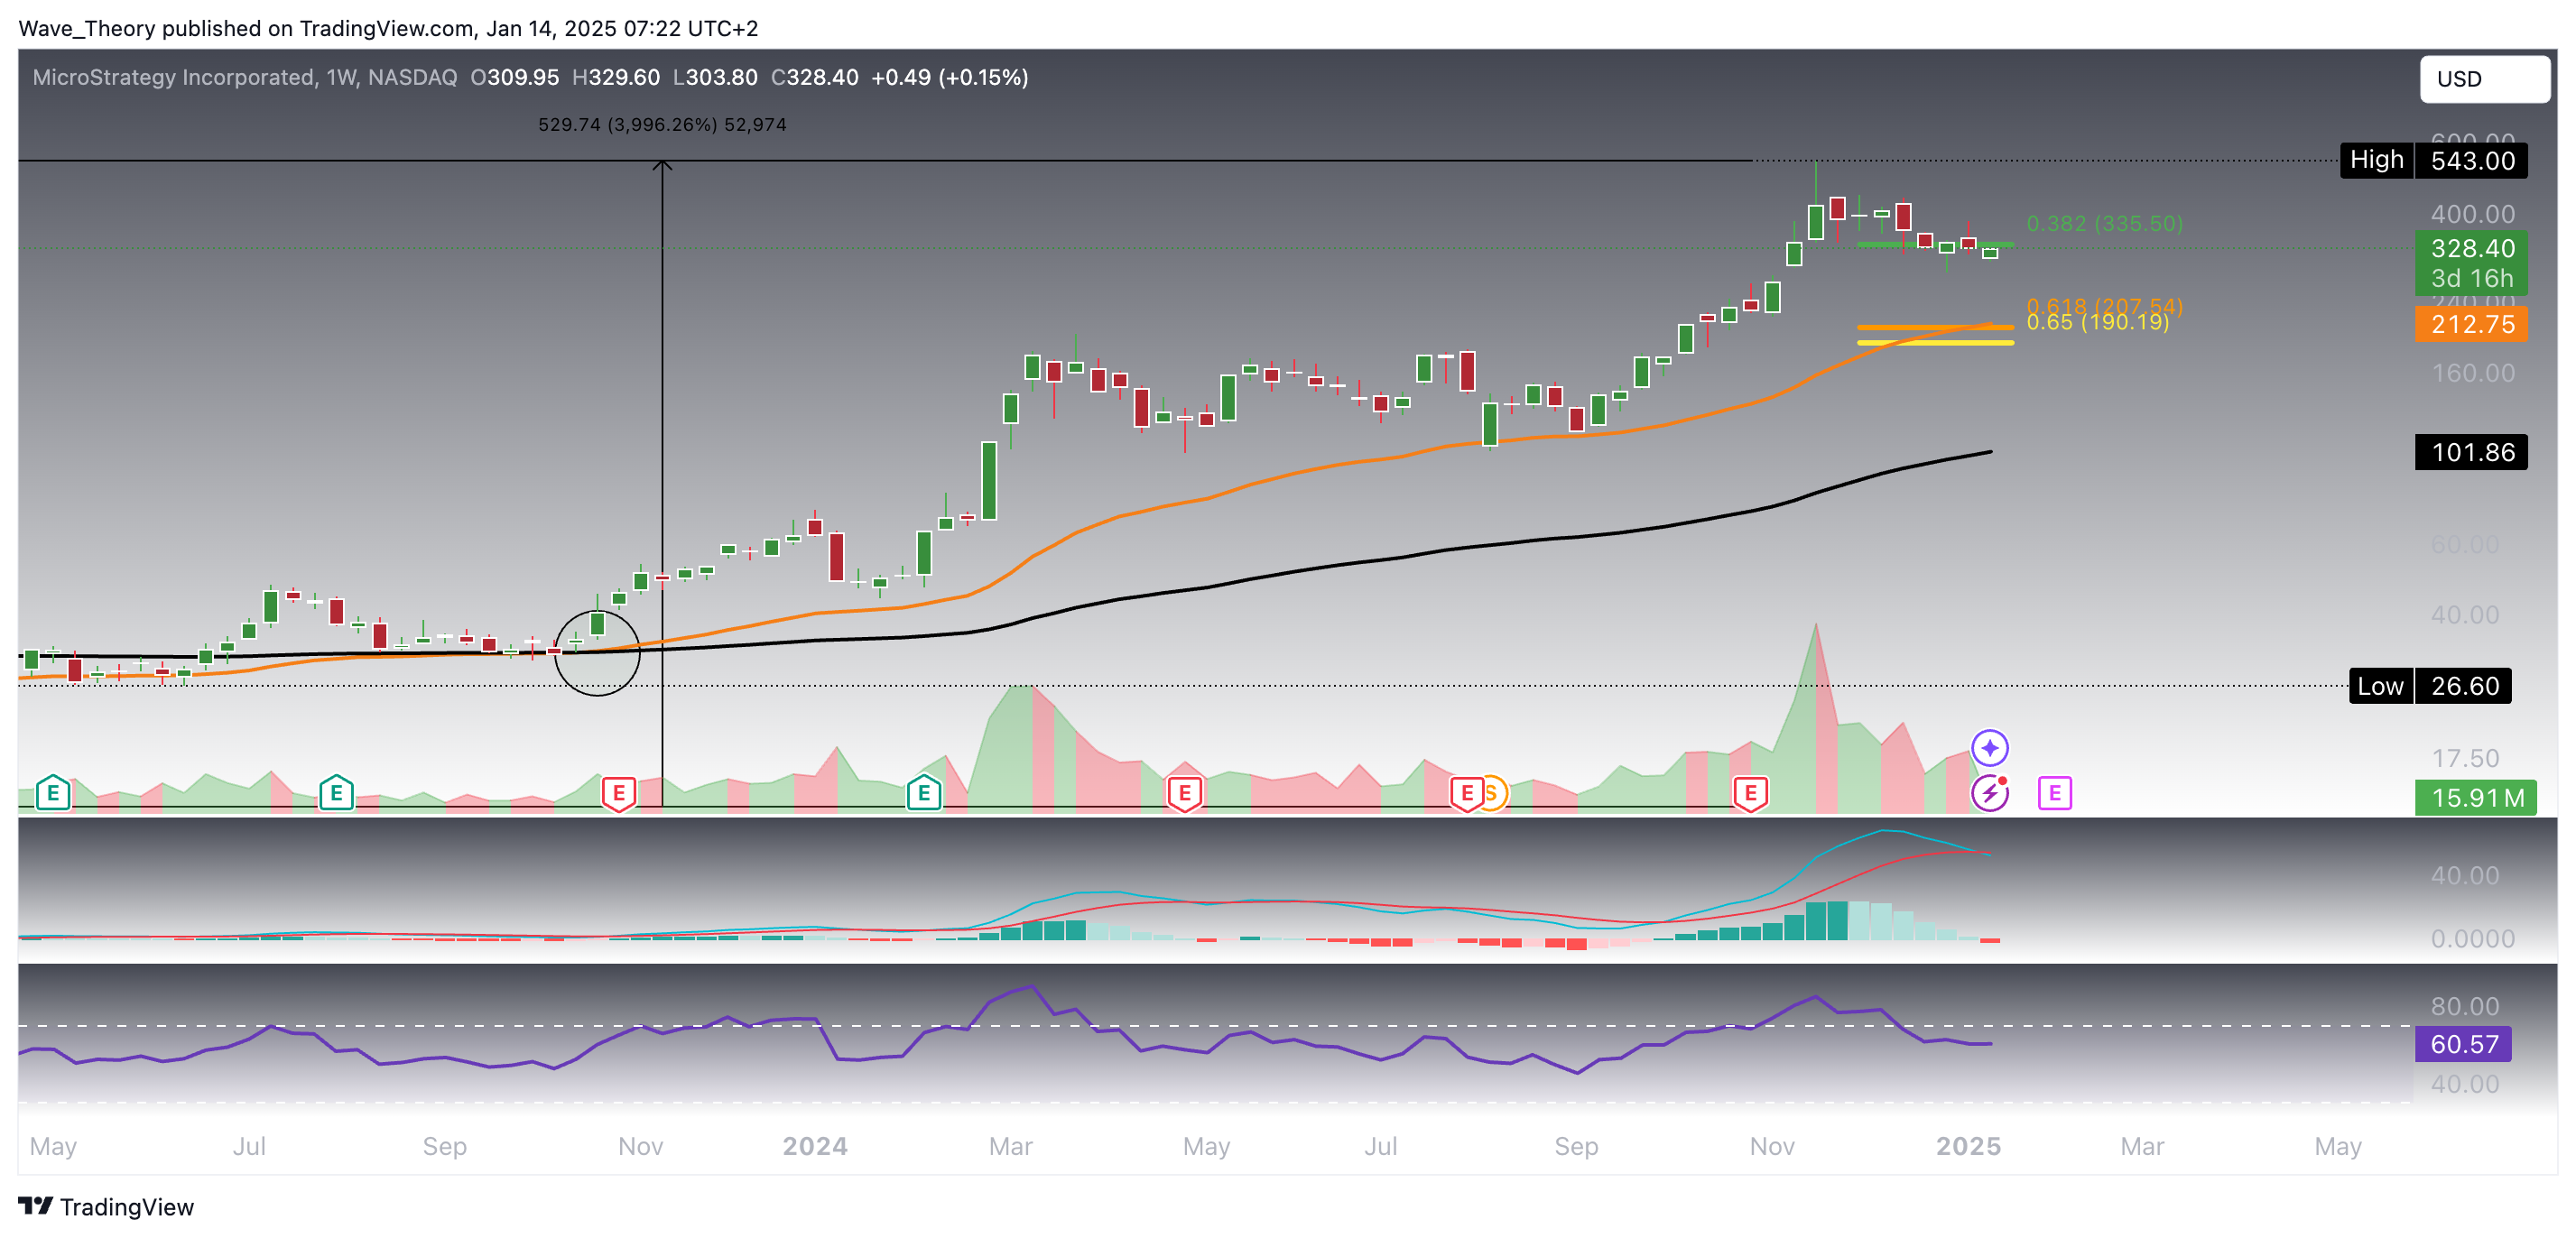
The Weekly Chart Looks Bearish For MicroStrategy
On the weekly chart, MicroStrategy (MSTR) exhibits a more bearish outlook, especially in the short term. Last week, the stock broke the 0.382 Fibonacci support at $335, signaling the potential for further downside movement. This breakdown opens the possibility of a deeper correction toward the golden ratio support around $200, which coincides with the 50-week EMA providing additional support at $213. Here’s a closer look at the technical picture:
Bearish Indicators on the Weekly Chart
- MACD: The MACD lines have now crossed bearishly, indicating a shift in momentum to the downside. Additionally, the MACD histogram is exhbiting a bearish trend, further signaling that bearish momentum is picking up strength. This points to increased selling pressure, suggesting that MSTR could continue to move lower in the near term.
- RSI: While the RSI remains in neutral territory, it is neither oversold nor overbought, indicating there is still room for movement in either direction. Given the bearish momentum in price action, the RSI could start to trend lower, but for now, it does not provide a clear signal.
- EMAs: Despite the bearish indicators, the golden crossover of the EMAs (the 50-week EMA crossing above the 200-week EMA) still confirms a mid-term bullish trend. This suggests that while the short-term outlook may be bearish, the broader bullish trend remains intact for now, and a reversal could still occur after this correction.
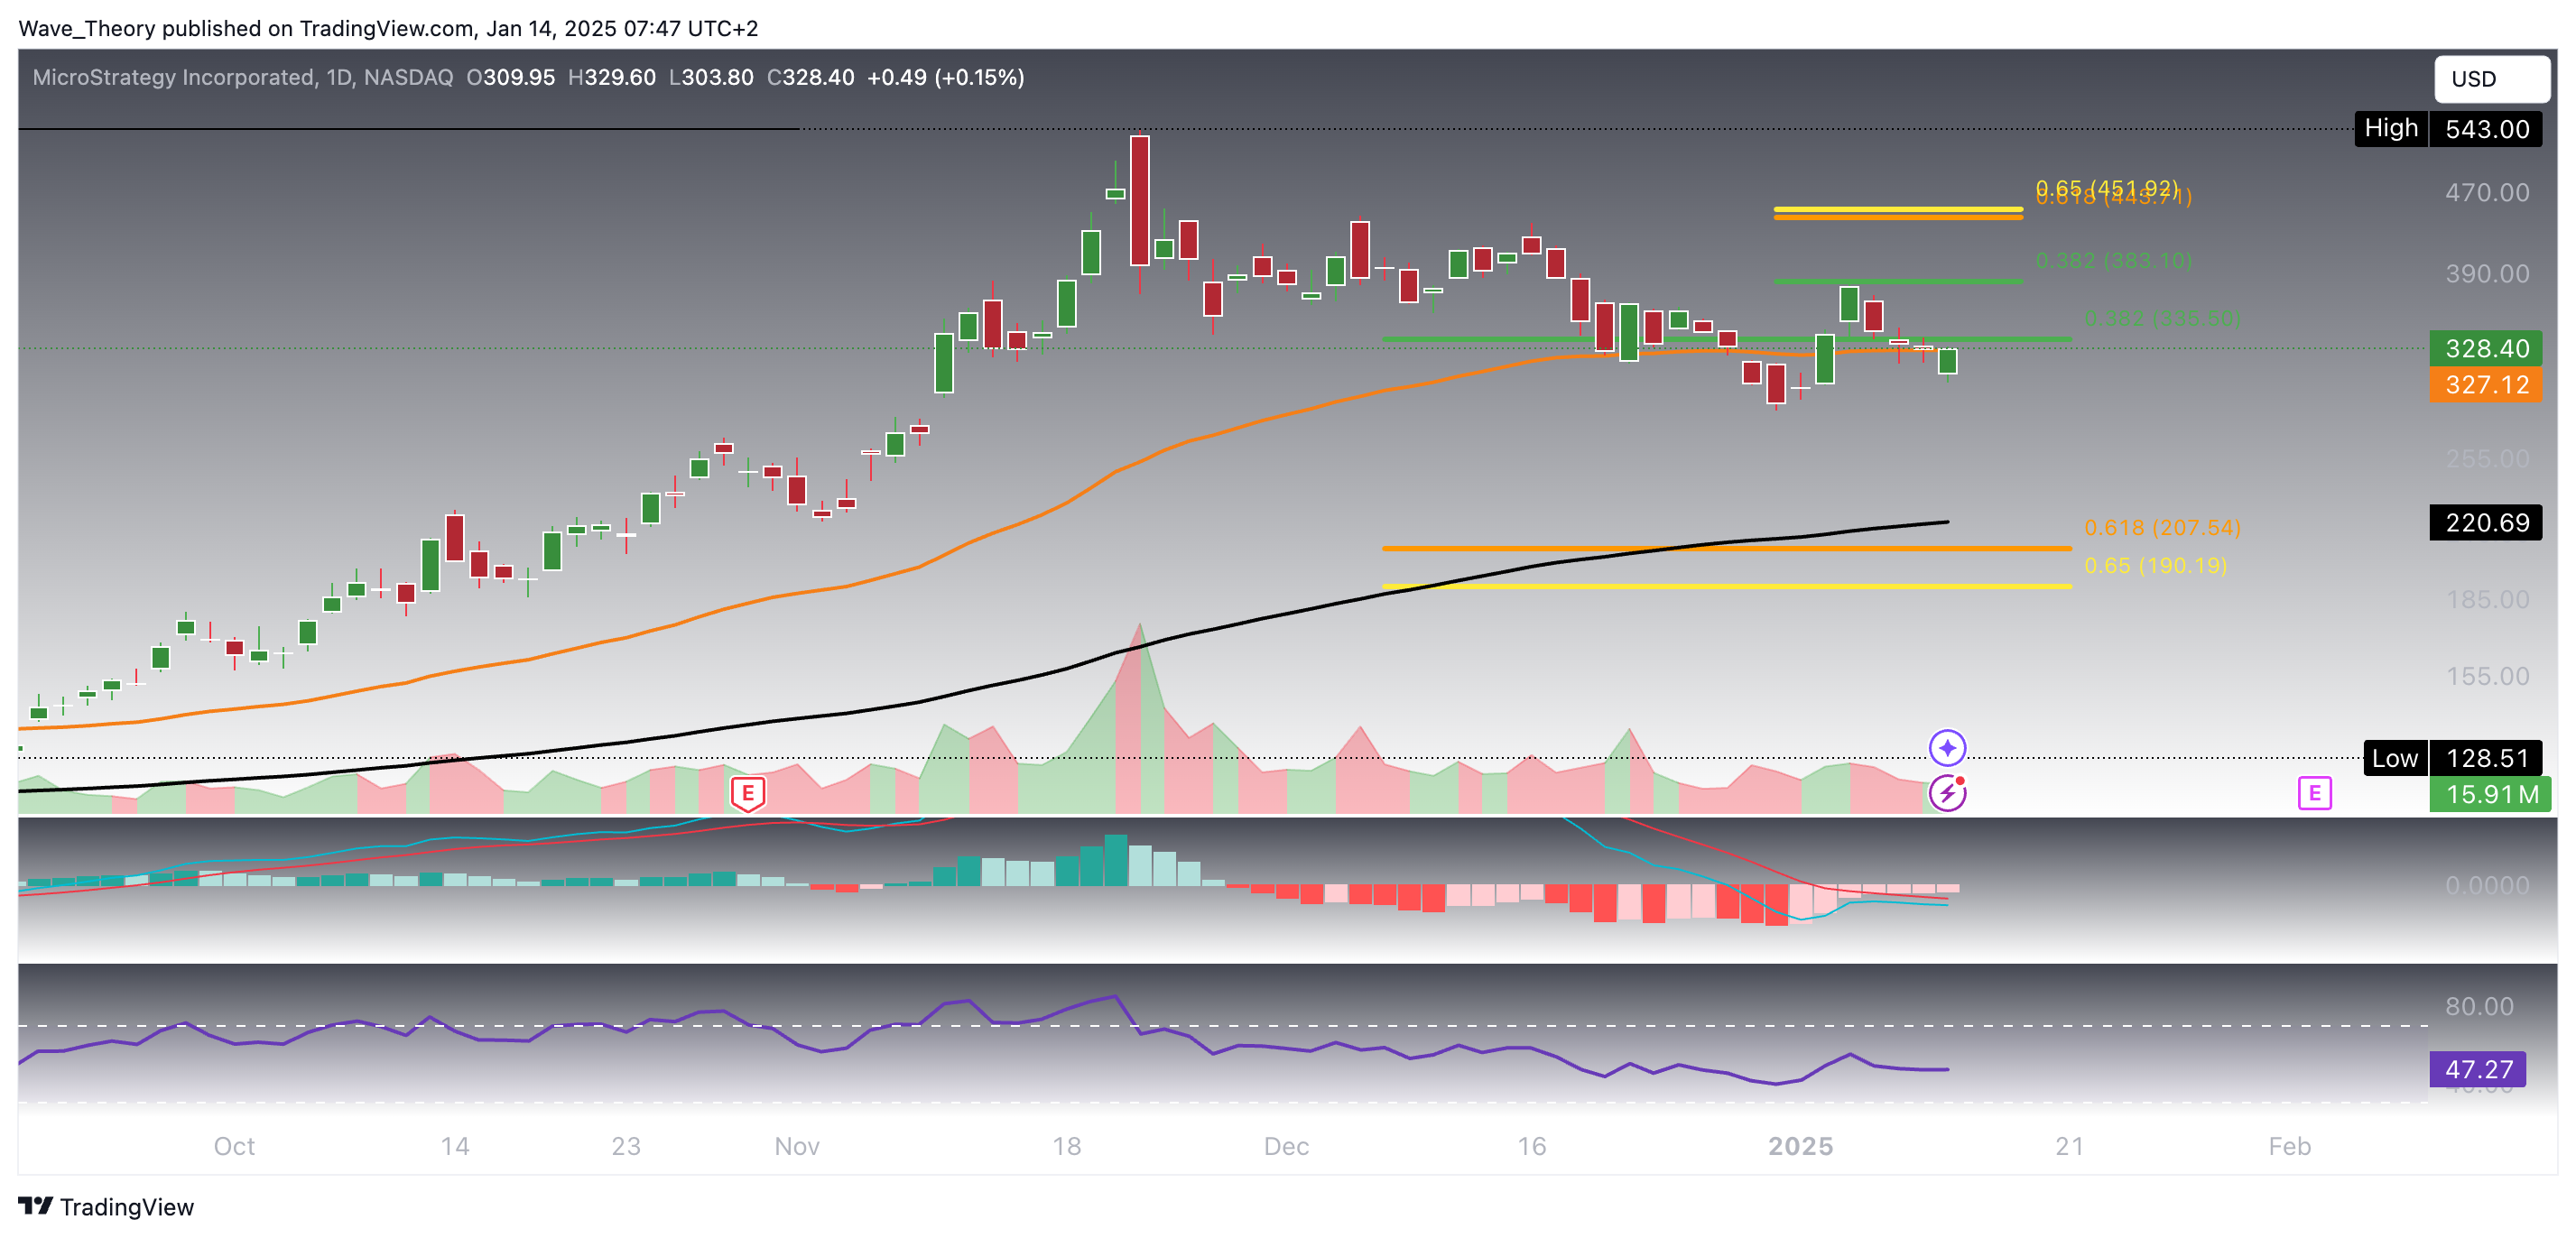
On the daily chart, there are emerging signals suggesting a potential upward move in MicroStrategy (MSTR). The MACD histogram has been ticking higher in recent days, hinting at the possibility of a bullish crossover of the MACD lines soon. This could indicate a shift in momentum toward the upside. Additionally, while the RSI remains neutral, it has room to rise, and the EMAs are still crossed bullishly, confirming the uptrend in the short to medium term.
Currently, MSTR appears to be initiating an upward movement, potentially correlated with Bitcoin’s recent price action, as MicroStrategy’s stock tends to mirror BTC’s performance. Despite this bullish outlook, MSTR was bearishly rejected at the 0.382 Fibonacci resistance at $383 just a few days ago. This level remains a key short-term barrier.
Key Resistance Levels to Watch:
- 0.382 Fib Resistance at $383: MicroStrategy could attempt to retest this resistance level in the near term. If it breaks above it, this could signal a more sustained upward move.
- Golden Ratio at $452: If MSTR breaks through the golden ratio at $452, it would invalidate the current correction. A bullish breakout at this level could propel the stock back toward the ATH at $543, or even higher, depending on broader market conditions.
In summary, while the stock has faced resistance recently, there are technical signals hinting at the potential for a bullish continuation. A break of the $383 resistance could lead to a strong upward move, with the $452 golden ratio being the key level to watch for confirming a full reversal of the correction.
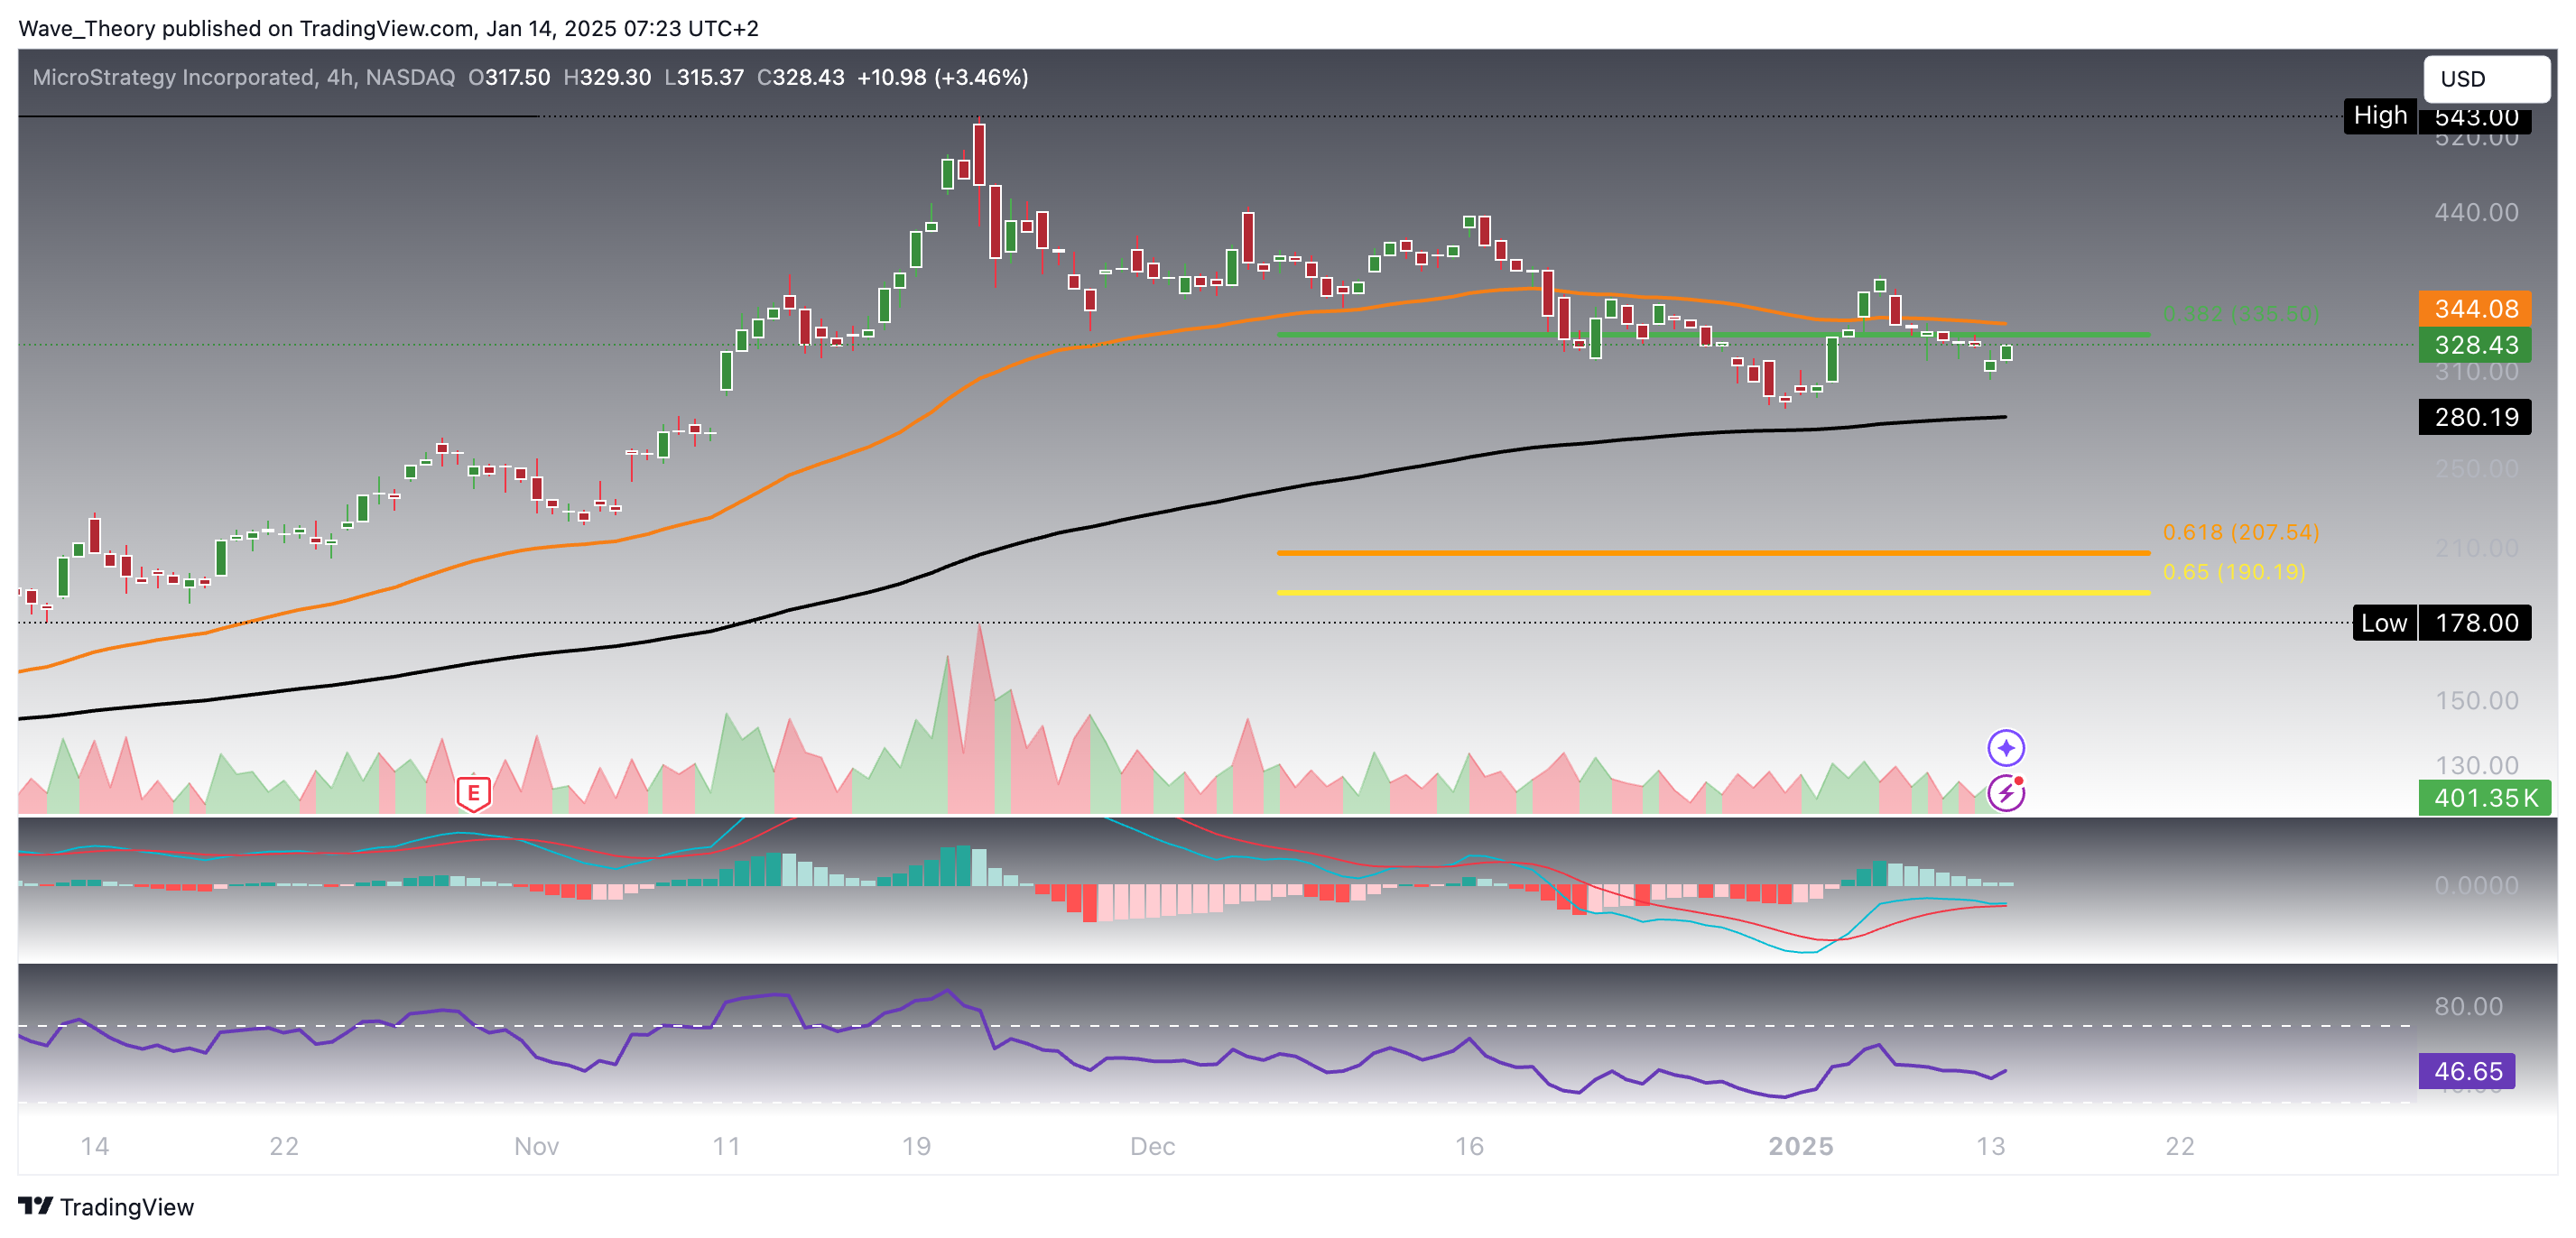
Mixed Signals On The 4H Chart
- Check out our free forex signals
- Follow the top economic events on FX Leaders economic calendar
- Trade better, discover more Forex Trading Strategies
- Open a FREE Trading Account
- Read our latest reviews on: Avatrade, Exness, HFM and XM
Related Articles


Sidebar rates
Related Posts
