Warner Bros Stock Surges Nearly 350% — Can the Rally Continue?

Quick overview
- Warner Bros. Discovery's stock has surged by nearly 300% since April 2023, recovering from a historic low of $6.64.
- Despite the impressive rebound, the long-term trend remains bearish until the stock breaks above the key resistance level at $53.
- Technical indicators show mixed signals, with bullish momentum on shorter timeframes but a death cross on the monthly chart.
- Key support levels to watch for potential corrections are at $20 and $15, reinforced by the 50-day and 200-day EMAs.
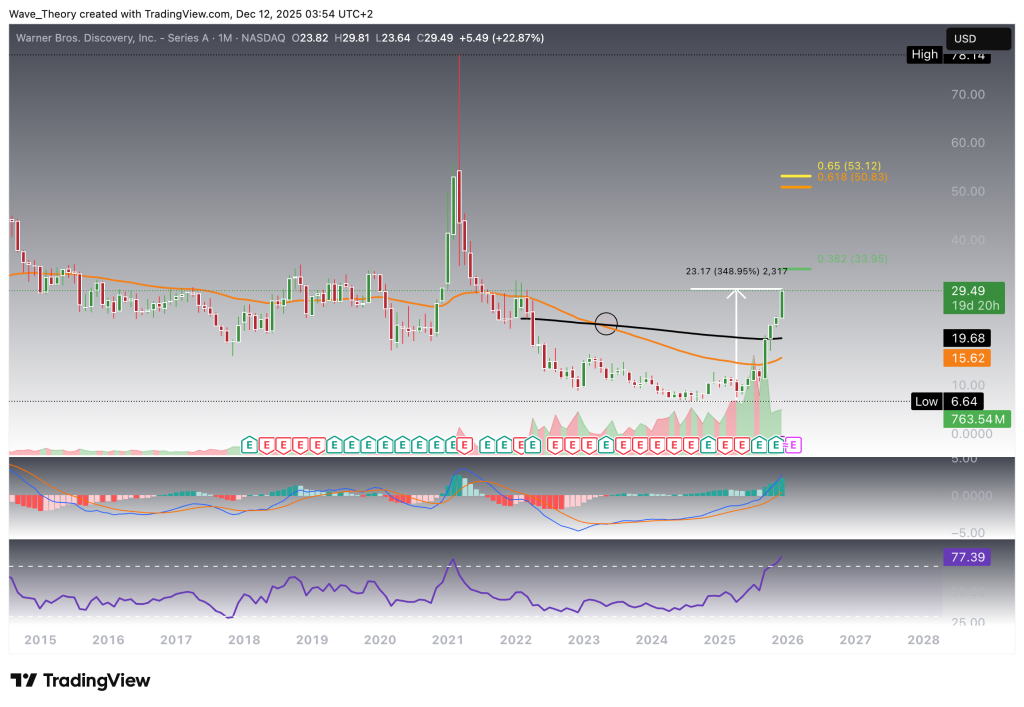
After a pivotal crash in 2021, Warner Bros. Discovery (WBD) plunged 91.5%, collapsing to a historic low of $6.64—coming within striking distance of its 2008 housing-crisis all-time low at $5.22.
Since April Warner Bros Stock Surged By A Staggering 300 %
Since April of this year, Warner Bros. Discovery (WBD) has staged an extraordinary recovery, surging by 296.41%. Measured from the August low last year, the stock has rallied by nearly 350%, marking one of its strongest multi-month advances in decades. Should this upward momentum persist, WBD will encounter its next major resistance at the Fib level around $34. A true structural trend reversal, however, requires a decisive breakout above the golden ratio at $53—a level that, from current prices, implies nearly a doubling of the stock.
From an indicator standpoint, the monthly chart presents mixed signals. The EMAs remain in a death cross configuration, confirming the long-term trend as structurally bearish. Conversely, the MACD lines are bullishly crossed, yet the MACD histogram has been ticking higher for several months, signaling persistent bullish momentum beneath the surface. Meanwhile, the RSI continues to push toward overbought territory, reflecting strong buying pressure but also suggesting a possible cooling phase ahead.
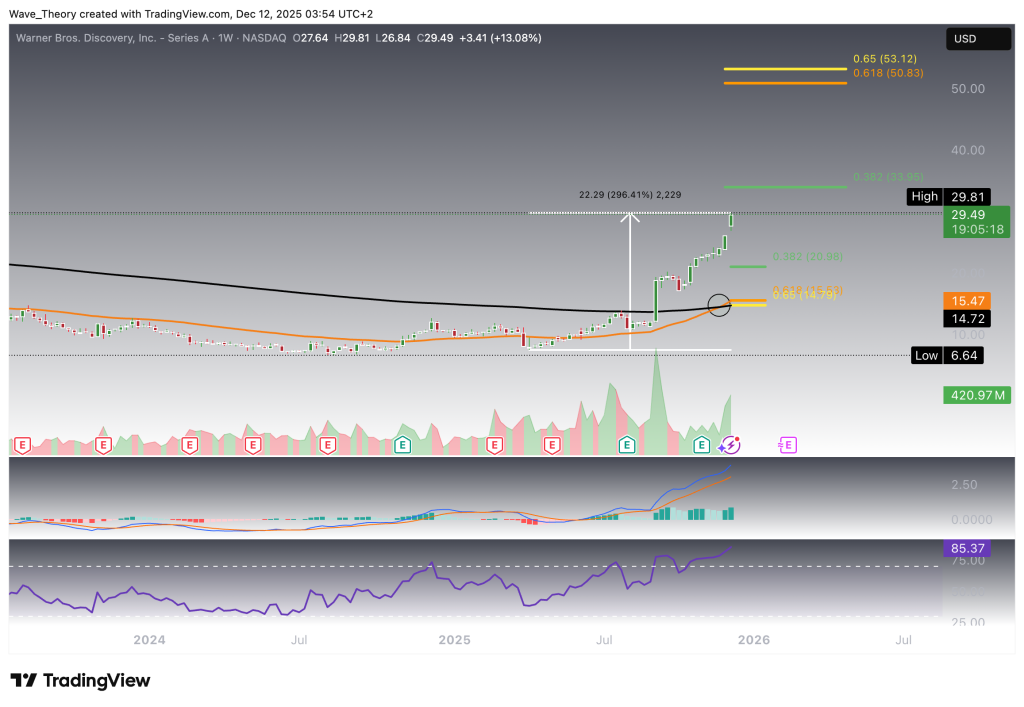
Golden Crossover Emerges on the Weekly Chart
On the weekly timeframe, Warner Bros. has now formed a golden crossover in the EMAs, confirming a bullish mid-term trend structure. Momentum continues to strengthen, with the MACD histogram rising steadily since last month and the MACD lines already crossed bullishly, reinforcing the upward bias. Meanwhile, the RSI has entered overbought territory, yet shows no signs of a bearish divergence, suggesting that despite elevated levels, upward momentum may still have room before a corrective move becomes technically necessary.
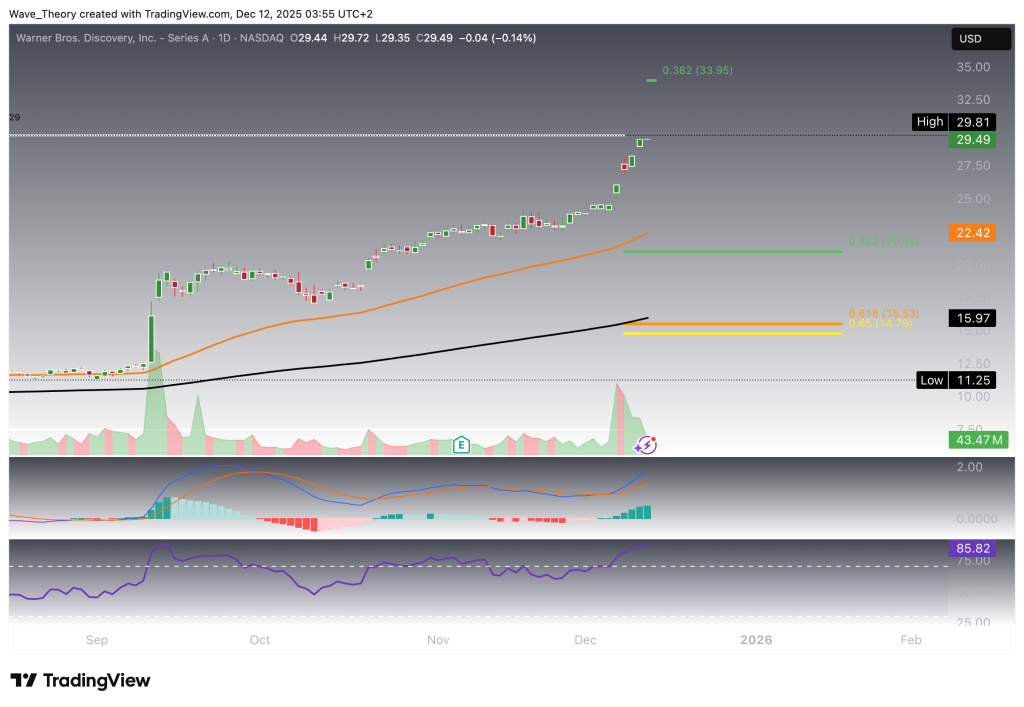
Bullish Signals on the Daily Chart
On the daily chart, Warner Bros continues to deliver predominantly bullish signals. The EMAs have formed a golden crossover, confirming the short- to medium-term trend decisively to the upside. Adding to this momentum, the MACD lines are bullishly crossed, and the MACD histogram has been ticking higher for several consecutive days, indicating sustained positive momentum.
Meanwhile, the RSI is trading in overbought territory, yet it shows no bearish divergences, suggesting that upward momentum remains intact for now.
Should the stock enter a corrective phase, WBD faces its next significant Fibonacci support levels at $20 and $15. Notably, the 50-day and 200-day EMAs align closely with these zones, providing strong confluence and reinforcing these regions as major support.
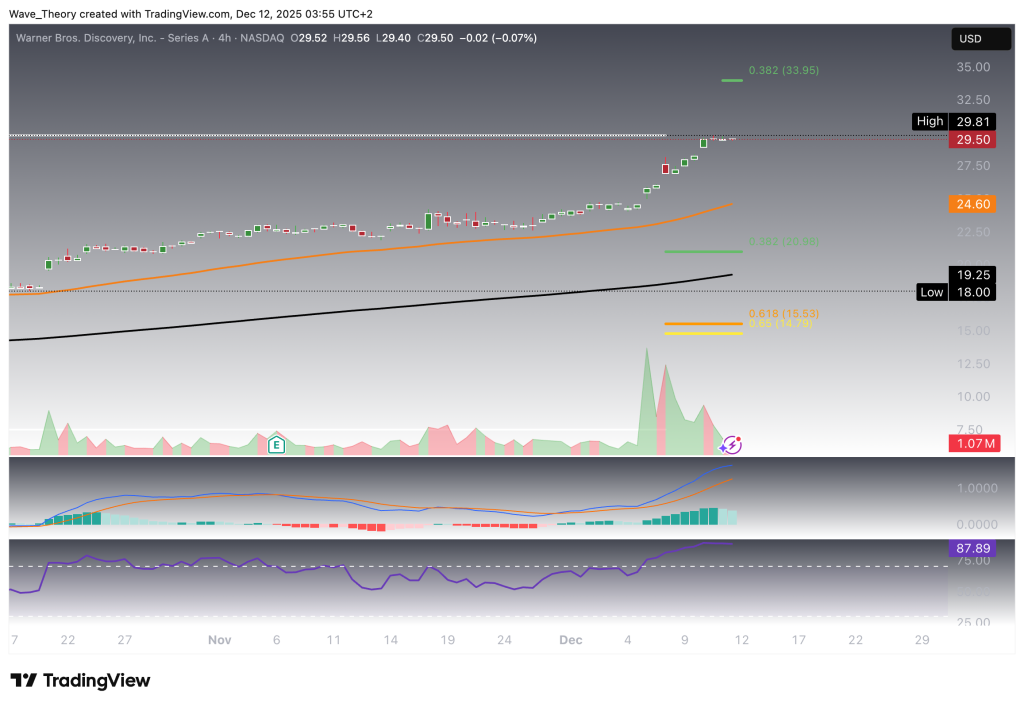
Similar Outlook on the 4H Chart, but With a Weakening MACD Histogram
On the 4H chart, Warner Bros shows a similar technical structure to the higher timeframes, but with early signs of momentum fatigue. The MACD lines remain bullishly crossed, yet the MACD histogram is beginning to show weakening momentum, indicating a potential slowdown in the short-term bullish impulse. Simultaneously, the EMAs continue to confirm a bullish trend in the short-term, maintaining upward alignment. Meanwhile, the RSI sits in overbought territory, but offers neither bullish nor bearish divergence signals at this stage. Overall, the 4H chart supports a bullish bias, albeit with a cautionary note due to the softening MACD histogram.
Summary & Key Levels – Warner Bros (WBD)
Warner Bros has staged an explosive recovery, surging 296% since April and nearly 350% from the August 2024 low. Despite this massive rebound, the broader downtrend remains technically intact until the stock breaks above the golden ratio resistance at $53. In the near term, WBD faces its first major resistance at the Fib level at $34.
The multi-timeframe technical picture is mixed but leans bullish:
- Monthly chart: Long-term trend remains bearish with a death cross, though momentum is improving as the MACD histogram rises for several months and RSI approaches overbought territory.
- Weekly chart: Structure turns mid-term bullish with a golden crossover, bullishly crossed MACD lines, and strengthening histogram—RSI overbought but without bearish divergence.
- Daily chart: Strong short- to mid-term bullish trend, supported by a golden crossover and rising MACD. Should a correction occur, key support lies at $20 and $15, reinforced by the 50-day and 200-day EMAs.
- 4H chart: Trend remains short-term bullish, though MACD histogram momentum is weakening and RSI is overbought.
Key Levels to Watch:
- Immediate resistance: $34
- Major trend-reversal level (golden ratio): $53
- Supports on pullbacks: $20 and $15
- Ultimate bullish target (if $53 breaks): Retest of higher-timeframe levels above
Overall, Warner Bros shows powerful bullish momentum across most timeframes, but the long-term trend only flips decisively once $53 breaks.
- Check out our free forex signals
- Follow the top economic events on FX Leaders economic calendar
- Trade better, discover more Forex Trading Strategies
- Open a FREE Trading Account
- Read our latest reviews on: Avatrade, Exness, HFM and XM
Related Articles


Sidebar rates
Related Posts
