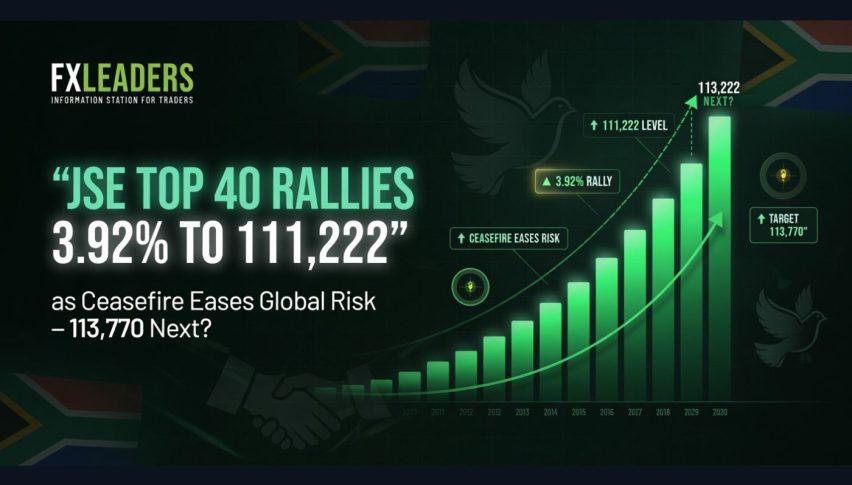
JSE Top 40 Rallies 3.92% to 111,222 as Ceasefire Eases Global Risk – 113,770 Next?
On May 6, 2026, the FTSE/JSE Top 40 Index rose about 3.92% to close at 111,222, showing a strong bounce after a period...
Quick overview
- On May 6, 2026, the FTSE/JSE Top 40 Index rose 3.92% to close at 111,222, indicating a strong recovery after previous sideways trading.
- Easing geopolitical tensions and a resumption of tanker traffic through the Strait of Hormuz improved global risk sentiment and boosted commodity stocks.
- Major mining companies led the gains, supported by higher precious metals prices and a weaker U.S. dollar, while the South African rand strengthened against the dollar.
- Technical analysis suggests the JSE Top 40 is holding well within a downward channel, with potential for further gains if it surpasses the 111,500 mark.
On May 6, 2026, the FTSE/JSE Top 40 Index rose about 3.92% to close at 111,222, showing a strong bounce after a period of sideways trading.
Key Drivers Today
- Easing Geopolitical Tensions: Global risk sentiment improved as the U.S.-Iran ceasefire held and some tanker traffic resumed through the Strait of Hormuz. This helped calm fears about supply disruptions and lifted commodity stocks.
- Resource Sector Leadership: Major mining and resource companies like AngloGold Ashanti, Gold Fields, Harmony, Impala Platinum, and Sibanye Stillwater led the gains. Higher precious metals prices, a weaker U.S. dollar, and lower energy costs supported the sector.
- Rand Support: The South African rand gained slightly against the dollar, which helped exporters and eased import costs for local businesses.
- Broader Market Context: Naspers/Prosus and Richemont also added to the gains as investors showed more interest in emerging markets. Bank and consumer stocks had mixed results as investors weighed better risk appetite against concerns about local economic data.
So far this year, the JSE has benefited from strong exposure to commodities, but global events still cause a lot of market swings.
Technical Analysis
The JSE Top 40 is trading close to 111,090, holding up well after testing the lower end of a downward channel that started from the March high near 122,500. The latest green candle formed a bullish hammer where the blue dynamic support meets the 108,635 to 108,248 zone.
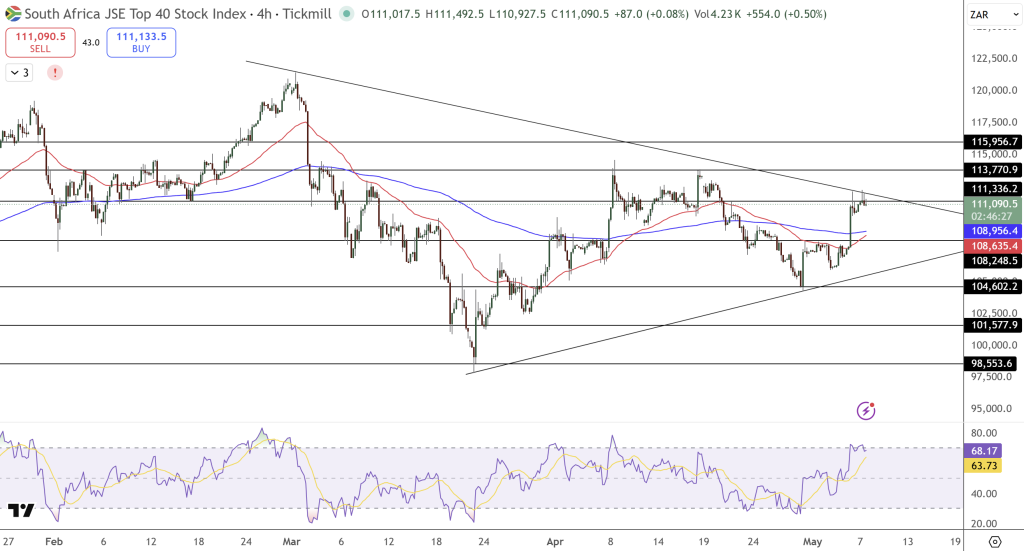
The price is still below the red moving average near 113,770 and is staying close to the middle of the channel. The chart shows higher lows since the April low, which could mean a falling wedge is forming. The RSI is neutral to bullish at 63.73 to 68.17, suggesting some positive momentum and more room to rise before becoming overbought.
Key Levels:
- Resistance: 111,336 → 113,770 → 115,956
- Support: 108,635 → 108,248
Trade Idea: Consider buying if the price goes above 111,500, aiming for 113,770, with a stop below 108,635.
- Check out our free forex signals
- Follow the top economic events on FX Leaders economic calendar
- Trade better, discover more Forex Trading Strategies
- Open a FREE Trading Account
- Read our latest reviews on: Avatrade, Exness, HFM and XM
Related Articles

Sidebar rates
Related Posts
