Nvidia Stock Forecast: NVDA Drops 1.6% as AI-Chip Rotation Tests Key Support
NVDA stock: Nvidia stock NVDA slips 1.6% as AI-chip rotation pressures NVDA, but 200-day support keeps bulls in the fight.
Quick overview
- NVIDIA Corp. closed at $195.74, down 1.59%, with a further decline in after-hours trading.
- Despite strong fundamentals and an 85% revenue increase, concerns about the sustainability of profit growth linger.
- The stock's technical setup has weakened, with key moving averages signaling sell pressures.
- NVIDIA's long-term support remains intact, but a drop below $188 could lead to a deeper pullback.
NVIDIA Corp. (NASDAQ: NVDA) closed at $195.74, down 1.59% on the day, as investors continued to rotate through the AI-chip trade. Shares slipped another 0.50% after hours to $194.77.
The pullback comes even as Nvidia’s long-term growth story remains intact, with AI infrastructure demand, AWS cloud expansion, and Blackwell-related supply commitments still supporting the bullish case.
Nvidia Stock’s Rally Cools as AI Trade Broadens
The reference article highlights a key shift in 2026: Nvidia is still the AI leader, but investors have been chasing other semiconductor bottlenecks.
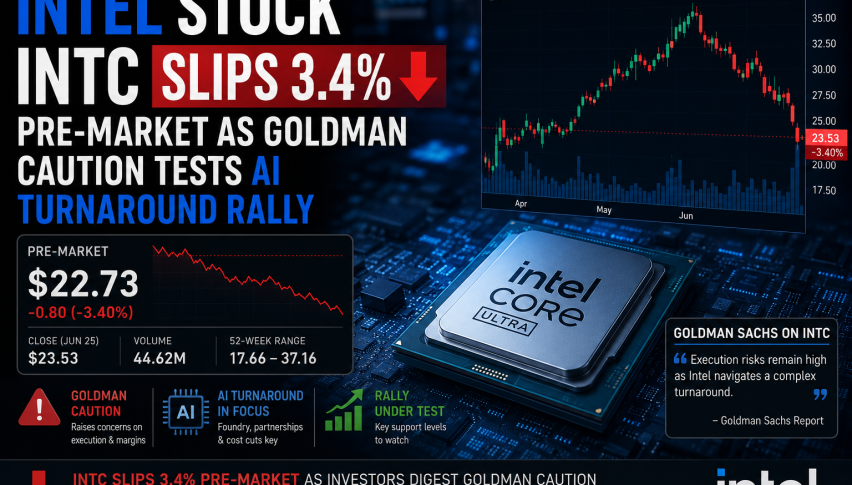
Memory names such as Micron and Sandisk have surged as AI data centers drive shortages in storage and high-bandwidth memory. Meanwhile, CPU and inference-related stocks have also gained attention as investors look for the next leg of AI infrastructure growth.
That has left Nvidia lagging some semiconductor peers, despite strong fundamentals. The company remains one of the world’s most valuable businesses, with revenue growth still powered by demand for AI accelerators.
Strong Fundamentals, But Sustainability Questions Remain
Nvidia’s business performance remains impressive. The reference article notes that revenue jumped 85% in the latest quarter, while adjusted net income more than doubled.
The bull case rests on several points:
- AI training and inference demand remains strong
- Blackwell and Rubin revenue visibility extends into 2027
- Nvidia has reportedly secured around $145 billion in supply and purchase commitments
- AWS is expanding Nvidia-backed AI infrastructure across EC2 and OpenSearch
Still, the market is questioning whether Nvidia’s profit growth can stay this strong once the AI capex cycle matures. That sustainability debate is one reason the stock has struggled to reclaim recent highs.
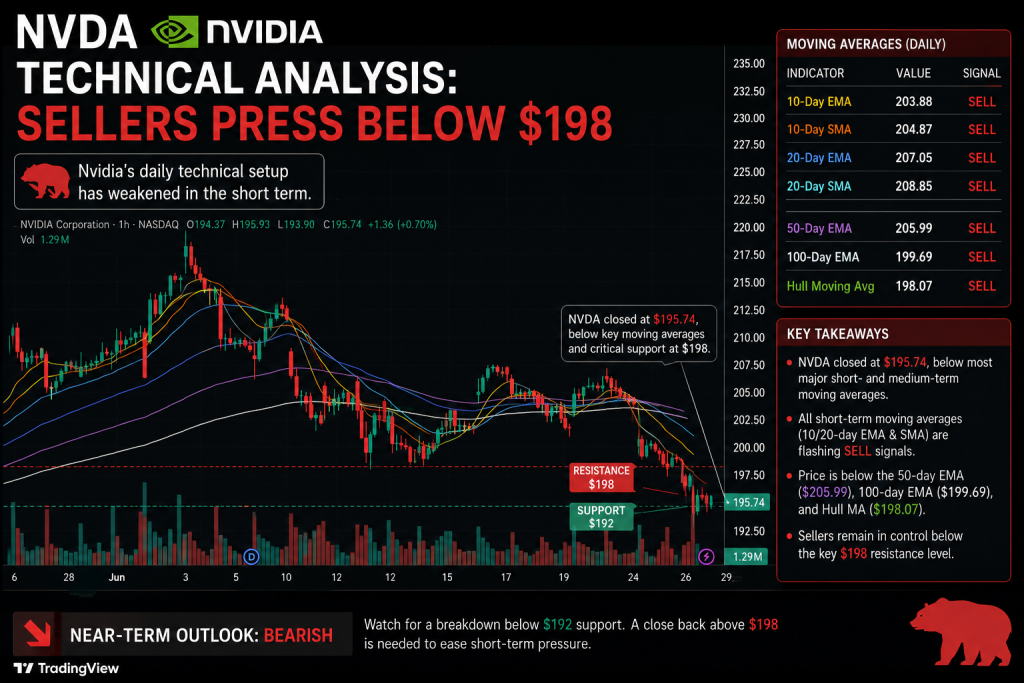
NVDA Technical Analysis: Sellers Press Below $198
Nvidia’s daily technical setup has weakened in the short term.
NVDA closed at $195.74, below most major short- and medium-term moving averages. The 10-day EMA at $203.88, 10-day SMA at $204.87, 20-day EMA at $207.05, and 20-day SMA at $208.85 all flash sell signals.
The stock is also below the 50-day EMA at $205.99, 100-day EMA at $199.69, and Hull Moving Average at $198.07, keeping near-term pressure on the chart.
However, long-term support remains intact. NVDA is still trading above its 200-day EMA at $188.58 and 200-day SMA at $190.53, both of which remain buy signals.
Momentum is mixed. The RSI at 39.58 is neutral but leaning weak, while MACD at -2.94 remains a sell signal. Momentum at -4.68 and Williams %R at -84.12 show buy signals, suggesting the stock may be approaching a short-term reset zone.
Key Levels to Watch
- Resistance: $198.07, $199.69, $203.88, $204.87, $207.05, $208.85, $212.21
- Support: $190.53, $188.58, $185.00, $180.00
- Bullish reversal level: A daily close above $198-$200
- Bullish continuation level: A break above $208-$212
- Bearish risk level: A drop below $188
Nvidia Stock Forecast
If NVDA can hold the $188-$191 support zone, buyers may try to defend the longer-term uptrend and push the stock back toward $198-$200.
A daily close above $200 would ease near-term pressure, but bulls likely need a stronger move above $208-$212 to rebuild momentum.
However, a break below $188 would weaken the long-term support structure and could expose Nvidia to a deeper pullback toward $185 and $180. For now, NVDA remains technically cautious but not broken while it holds above the 200-day moving averages.
- Check out our free forex signals
- Follow the top economic events on FX Leaders economic calendar
- Trade better, discover more Forex Trading Strategies
- Open a FREE Trading Account
- Read our latest reviews on: Avatrade, Exness, HFM and XM
Related Articles
Sidebar rates
Related Posts
