WTI Crude Oil Price Forecast: $69 Channel Floor Tested as Strait of Hormuz Traffic Improvements Erase 7% Weekly Risk Premium
The global energy complex has been rapidly reshaped by structural forces over the past week, leaving front-month energy contracts exposed...
Quick overview
- The global energy market has experienced a significant sell-off, with US WTI Crude prices dropping to $70.43 a barrel as fears of conflict eased.
- The Islamabad MOU has restored 85% of shipping capacity in the Strait of Hormuz, alleviating concerns over oil supply disruptions.
- Despite a sharp decline in oil inventories, the Fed's tight monetary policy is dampening demand and keeping crude prices under pressure.
- Technical analysis suggests that WTI Crude is oversold, indicating a potential for a short-term price rebound.
The global energy complex has been rapidly reshaped by structural forces over the past week, leaving front-month energy contracts exposed to a heavy sell-off on last Friday, June 26, 2026. As fears of a global conflict subsided and commercial traders began offloading their war-risk premiums, US WTI Crude(OIL) plummeted by 2.07% in the early hours of the session. That price decline brought the benchmark contract to $70.43 a barrel.
As weekend news confirmed that the Strait of Hormuz had returned to normal operations, index funds and commercial trading desks are unwinding their safe-haven positions. The expectation is that supply will rapidly return to oil refineries as major commercial shipping lanes return to full capacity.
Islamabad MOU Restores 85% of Strait of Hormuz Shipping Capacity
The Islamabad MOU has brought the Strait of Hormuz back to 85% of operational capacity. The main fundamental driver behind the crude price’s steep slide throughout the week was the growing success of the interim peace agreement between Iran and the US, known as the “Islamabad Memorandum of Understanding.” The deal was signed on June 19 in Switzerland following Pakistani diplomatic mediation and has steadily alleviated oil markets’ fears of disruptions to global crude supply and oil transportation channels over the course of the week.
The supply balance has been fundamentally shifted on the back of several developments:
- Strait Normalized: With the US blockade formally lifted, commercial shipping has returned to roughly 85% of historical levels at full operating capacity in the Strait. Shipping bottlenecks have been eliminated.
- Iranian Exports Accelerated: Iran’s oil storage has been released at an accelerated pace onshore and via floating storage, feeding directly into global oil refineries in the US or Europe and Asia.
- OPEC Compliance Pressures: Iran’s return to production is taking place as the OPEC+ cartel readies to unilaterally increase crude oil quotas. OPEC+ is scheduled to raise quotas by 188,000 barrels per day in the month of July. The cartel must watch the data from next month’s meeting closely to prevent market from becoming too oversupplied.
- Non-OPEC Oil and IEA Supply Demand: Oil production from non-OPEC producers in the US and shale in the US, Canada, Guyana and Brazil continues to maintain global crude output at record levels. This extra supply is keeping global oil production in line with steady demand growth, which is expected to stay relatively flat over the course of 2026 following slower growth in OECD economies, at roughly 1.2 million barrels per day, as predicted by both IEA and OPEC.
Heavy EIA Draw Fails to Block Restrictive Fed-Driven Monetarism
EIA data confirms that oil inventory fell, but not by much to counteract tight Fed monetary policy. Oil storage levels fell sharply across all categories in the US last week as reported on the weekly oil stocks report released by the US Energy Information Administration (EIA) on June 24. Commercial storage inventory (non-SPR) fell by 6.1 million barrels to 412.1 million barrels, the lowest inventory levels seen since January 2025, representing around 7% below the five-year seasonal average. Refineries were working hard, pushing utilization rates to 96.1%, but that massive inventory draw didn’t trigger a bullish rebound.
The paper traders were ignoring it entirely, concentrating on demand instead: gasoline implied demand fell 3.0% in the past four weeks to average 8.8 million b/d, and domestic product supplied was also hurt by a 3.1 million barrel build at distillate storage.
Still, even that kind of recovery has to confront Warsh’s monetary policy tightening on the Fed’s June 16-17 meetings. With core CPI at 4.1% and the rest of the economic data still sticky, the Warsh Fed is continuing its data-dependent hard-line, monitary stance, keeping rates steady at a 3.50%-3.75% target zone. By killing any prospects for near-term rate reductions, the Fed is helping push the U.S. dollar higher, making it more expensive for non-domicile countries to buy crude and thereby dampening global fuel-demand models.
Crude Oil Technical Analysis: USOIL Approaches Lower Border of Extended Descending Channel
Rather than focusing on the current state of macro policy, look at the 2-hour chart of West Texas Intermediate Crude Oil. WTI Crude Oil is still locked inside the extremely strong downward-descending trend channel that started in the middle of June, acting as resistance in all major upside rallies:
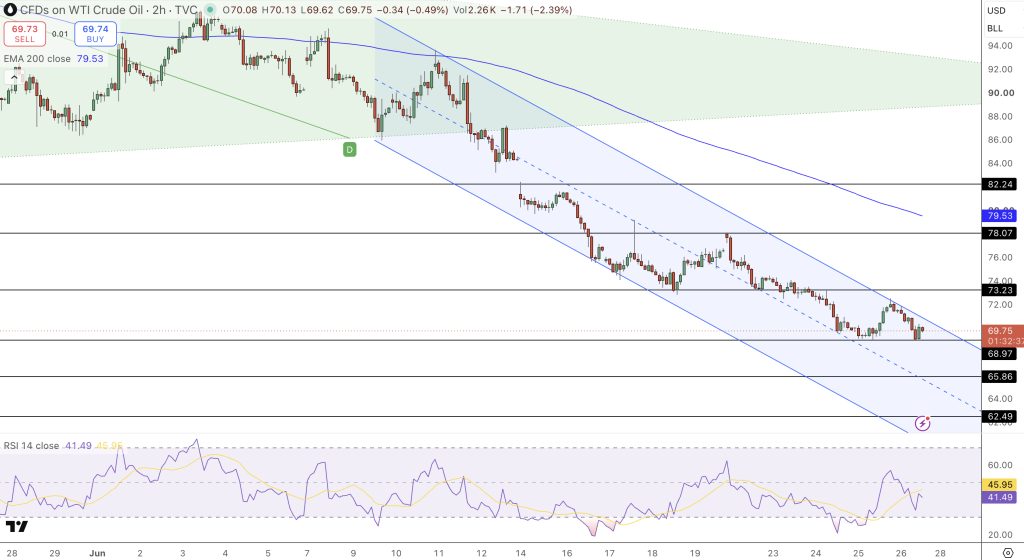
The commodity has just finished a violent decline to $70.43, and has been accompanied by multiple large-bodied red candlesticks; price is now touching the channel’s lower moving dynamic border (a major Point D structural base):
The 14-period RSI has dropped to its oversold levels, now at 41.49, and the moving-average convergence-divergence has begun to flatten out near its minimum levels. This is a classic oversold technical set-up which is likely to lead to a short-term covering bounce.
Concluding Thoughts and Trade Recommendation
WTI Crude Oil is currently undergoing a significant macroeconomic re-valuation as its war-risk premium evaporates, leaving the commodity once again to conventional supply-driven factors. The Fed’s hawkish monetary policy, and its subsequent impact on the value of the U.S. dollar, will continue to put a ceiling on WTI pricing over the long-term, but the extremely oversold 2-hour chart base should mean that the downside has become exhausted.
The Play: Take long positions once the 2-hour chart closes at the descending trend line support level at $68.97. Set the stop loss under the horizontal support base at $65.86, and target the next major resistance point at $73.23 (a short-covering rebound), and the more distant breakout point at $78.07.
- Check out our free forex signals
- Follow the top economic events on FX Leaders economic calendar
- Trade better, discover more Forex Trading Strategies
- Open a FREE Trading Account
- Read our latest reviews on: Avatrade, Exness, HFM and XM
Related Articles

Sidebar rates
Related Posts
Ava

