Will COST Stock Fall Below $900 as Costco’s June Sales Growth Slows?
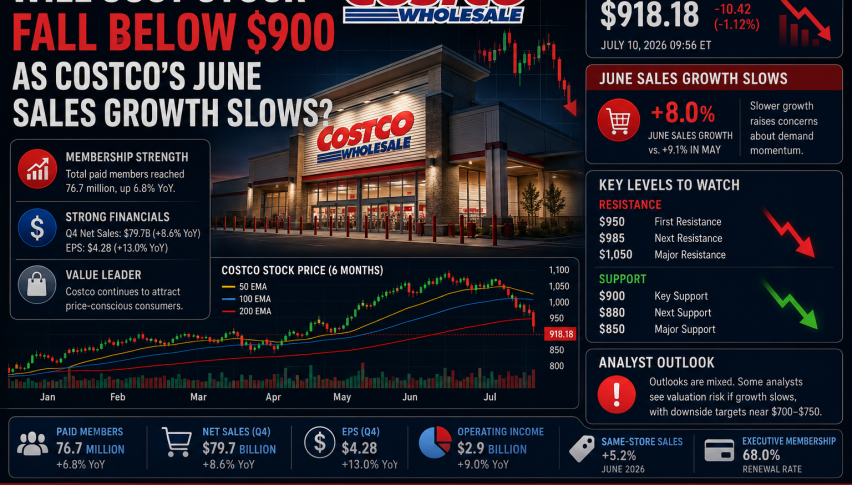
Costco stock COST drops as June comps slow and cash flow risk grows, with $910 support and $936 resistance now key.
Quick overview
- Costco's shares fell sharply due to decelerating June sales and concerns over its premium valuation.
- June comparable sales rose 8.8%, a slowdown from May's 12.5%, while digital sales continued to show strong growth.
- The company's free cash flow declined by 13% year over year, raising concerns about future capital expenditures and cash flow stability.
- Analysts remain cautious about Costco's stock price, emphasizing that even minor slowdowns can trigger selling pressure.
Costco shares dropped sharply after June comparable sales decelerated, while investors weighed premium valuation, weaker free cash flow expectations, and a still-resilient membership model.
Costco Selloff Tests Premium Valuation
Costco stock slid after investors reacted to slowing June sales momentum. The warehouse retailer is still growing faster than most large retailers, but its premium valuation leaves little room for even modest deceleration.
June Sales Slow From May’s Strong Pace
Costco reported June net sales of $29.24 billion, up 10.6% from the same period last year.
Comparable sales rose 8.8%, but that marked a slowdown from May’s 12.5% comp growth. Excluding gasoline price changes and foreign exchange, June comparable sales rose 7.0%, compared with 8.0% in May.
The U.S. business remained strong, with same-store sales up 7.6% on an adjusted basis. Worldwide traffic rose 3.2%, while average ticket increased 3.7% excluding gas.
These are not weak numbers, but the market expected more from a stock trading at one of the highest valuations in retail.
Digitally Enabled Sales Remain a Bright Spot
Costco’s digital channel continues to outperform.
Digitally enabled comparable sales rose 20.9% in June and 21.5% for the fiscal year to date. That shows Costco is gaining traction beyond the warehouse floor, even as physical traffic normalizes after a strong fuel-driven period.
The company also continues to benefit from its value-focused model, membership loyalty, and bulk-shopping appeal during a period when consumers remain price sensitive.
Costco’s Cash Flow Story Is More Complicated
The bigger concern may not be June comps alone.
Costco’s fiscal Q3 free cash flow fell about 13% year over year to $2.04 billion, and some consensus models point to a much steeper decline in fiscal Q4. The pressure comes from higher capital spending tied to warehouse expansion and timing around tariff refund claims.
Management has guided toward roughly $6.5 billion in fiscal 2026 capital expenditures as it accelerates store openings. Bulls see this as reinvestment that supports future growth. Bears argue that a richly valued stock cannot afford a prolonged cash-flow air pocket.
Analysts Stay Positive but Cautious on COST Stock
Citi reiterated a Neutral rating with a $1,020 price target after the June sales update.
Other firms, including Guggenheim, Wolfe Research, Truist, and D.A. Davidson, have also highlighted valuation concerns despite Costco’s strong operating performance.
The stock still has broad analyst support, but the key issue is price. Costco trades at a premium multiple compared with Walmart and most other retailers, so even a small slowdown can trigger selling.
COST Technical Analysis: Sellers Control the Trend
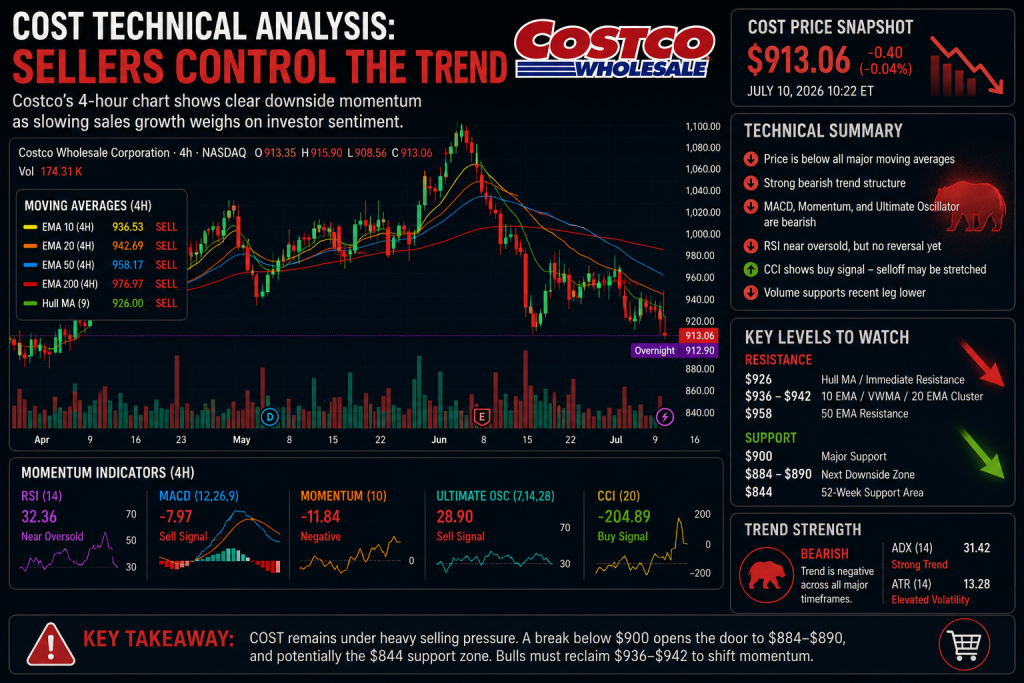
From a technical perspective, Costco’s 4-hour chart is clearly bearish.
COST is trading below the 10 EMA at $936.53, 20 EMA at $942.69, 50 EMA at $958.17, and 200 EMA at $976.97. All major moving averages are flashing sell signals, confirming strong downside pressure.
Momentum is weak. MACD is bearish at -7.97, Momentum is negative at -11.84, and the Ultimate Oscillator shows a sell signal at 28.90.
RSI sits at 32.36, close to oversold territory but not yet showing a confirmed reversal. The CCI at -204.89 is flashing a buy signal, suggesting the selloff may be stretched.
Key Levels: $900, $926 and $936
The first major support level is $900. If Costco breaks below that level, the next downside zone sits near $884-$890, followed by the 52-week support area around $844.
On the upside, the first resistance is $926, near the Hull Moving Average. A stronger rebound would require a move above $936-$942, where the 10 EMA, VWMA, and 20 EMA are clustered.
Until Costco reclaims that zone, the chart remains vulnerable.
Costco Is a Great Business, but an Expensive Stock
Costco remains one of the best operators in retail. Its membership model, traffic resilience, digital growth, and value proposition remain strong.
However, the market is no longer ignoring valuation. Slower sales growth, cash-flow timing risk, and heavy capital spending are enough to pressure a stock priced for excellence.
For now, $900 is the key support level. If buyers defend it, Costco could stabilize and rebound toward $936. If it breaks, the stock may face a deeper correction before the long-term compounder story reasserts itself.
- Check out our free forex signals
- Follow the top economic events on FX Leaders economic calendar
- Trade better, discover more Forex Trading Strategies
- Open a FREE Trading Account
- Read our latest reviews on: Avatrade, Exness, HFM and XM

Related Articles

Sidebar rates

Related Posts
 Save
Save