Crude Oil Price Forecast: Will Geneva Nuclear Talks Ignite a $70 Surge or a Massive Supply Crash?
Right now, the global energy market is tense, with Geneva in the spotlight. As of February 26, 2026, WTI Crude is steady near $65.60...
Quick overview
- The global energy market is currently tense, with WTI Crude steady near $65.60 and Brent around $71.10 amid geopolitical risks from US-Iran nuclear talks.
- Crude oil prices are influenced by a significant increase in U.S. inventories, which has led to an oversupply despite ongoing diplomatic efforts in Geneva.
- Key technical levels to watch include critical support at $65.28 and major resistance at $67.31, with the market in a cautious holding pattern.
- Traders should monitor news from Geneva, as outcomes could significantly impact price movements in the near future.
Right now, the global energy market is tense, with Geneva in the spotlight. As of February 26, 2026, WTI Crude is steady near $65.60 and Brent is around $71.10. The market is pulled between a big jump in U.S. inventories and the heightened geopolitical risks from the third round of US-Iran nuclear talks.
Is the recent price drop a chance to buy for a move toward $70, or will the “Double Top” pattern at $66 lead to a decline? Here’s a look at the main factors.
The Fundamental Conflict: Diplomacy vs. The Glut
Crude oil prices are being influenced by two very different factors:
- The Geneva Wildcard (The Bullish Case)
Energy traders are closely watching the ongoing diplomatic talks in Geneva. As the US and Iran work to avoid military conflict, the market is considering the risk of sudden supply disruptions. Iran, OPEC’s third-largest producer, is a key factor. Saudi Arabia has increased exports to help stabilize the market, but if the talks fail, prices could quickly rise above $70.
- The 16-Million-Barrel “Gut Punch” (The Bearish Case)
On the other hand, a major signal from the United States is holding prices back. The EIA recently reported a 16 million barrel increase in crude stockpiles, the largest weekly rise in years. This shows that, despite geopolitical concerns, the market is oversupplied because of lower refinery activity and higher imports.
Crude Oil Technical Analysis: The $65.28 Battleground
On the 2-hour chart, WTI appears to be entering a quieter phase. After pulling back from the mid-February high of $67.31, prices have found important support at $65.28, which matches the 0.382 Fibonacci retracement level.
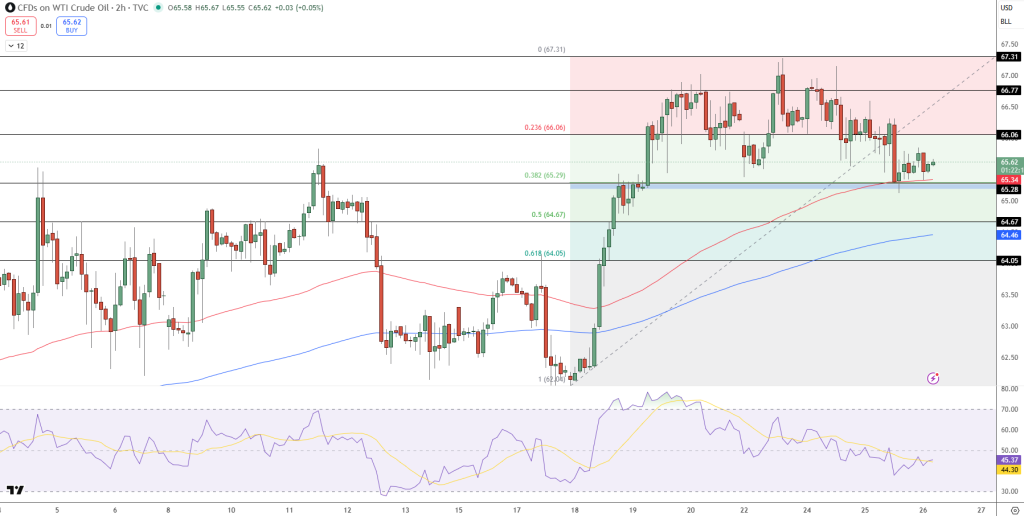
- Support comes from the 50-period moving average at $65.34 and the rising trendline from the $62.04 base. If WTI stays above $65.28, the overall bullish outlook remains.
- The ‘Double Top’ pattern is a concern. Buyers need to push prices above the $66.06 resistance and then $66.77 to cancel out this reversal pattern seen on longer timeframes.
- Momentum: The RSI is neutral in the mid-40s, which suggests the market is pausing before its next big move, likely influenced by news from Geneva.
Key Trading Levels to Watch
| Level Type | Price (WTI) | Significance |
| Major Resistance | $67.31 | The February peak; breaking this opens the door to $70. |
| Immediate Resistance | $66.06 | The 0.236 Fib level; the first hurdle for bulls. |
| Critical Support | $65.28 | The 0.382 Fib level; must hold to prevent a bearish shift. |
| Major Floor | $64.46 | The 200-period MA; the “line in the sand” for the long-term trend. |
The Analyst’s Verdict: Cautious Optimism
I see a market in a holding pattern. The large oversupply from the 16 million barrel build would usually push prices down, but concerns about a possible Middle Eastern supply shock are keeping prices supported. Right now, trading is driven by news headlines. If the Geneva talks move toward easing tensions, the oversupply could push prices down to $63.00. But if tensions rise, the technical setup could lead to a quick move higher.
Trade Idea: Watch for a bullish bounce and continuation above $65.28 targeting $66.77.
Stop Loss: A clean break below $64.67 invalidates the immediate recovery.
- Check out our free forex signals
- Follow the top economic events on FX Leaders economic calendar
- Trade better, discover more Forex Trading Strategies
- Open a FREE Trading Account
- Read our latest reviews on: Avatrade, Exness, HFM and XM
Related Articles


Sidebar rates
Related Posts
