GBP/USD Price Forecast: Sterling Consolidates Near 1.3500 as Renewed US-Iran Tensions Boost Dollar Safe-Haven Demand
GBP/USD has got stuck around 1.3500 as of April 20, 2026, opening with a small bearish gap and staying in the red early on in European...
Quick overview
- GBP/USD is currently hovering around 1.3500, facing bearish pressure due to renewed US-Iran tensions.
- The pair is struggling to move upwards, with key support at 1.3480–1.3500 and resistance at 1.3550–1.3590.
- Market sentiment is cautious, influenced by rising oil prices and the Bank of England's stance on interest rates.
- Technical analysis suggests a potential for a new higher low if support holds, but a drop below 1.3465 could lead to further declines.
GBP/USD has got stuck around 1.3500 as of April 20, 2026, opening with a small bearish gap and staying in the red early on in European trading hours. The pair had been choppy after a bit of a wild ride, but is now just hovering above the key support line at 1.3480–1.3500, struggling to make any kind of move upwards.
Key Drivers Today
- US-Iran Tensions Flaring Up Again: That temporary optimism about the Strait of Hormuz reopening and ceasefire deal really didn’t last long over the weekend. Iran went and shut the strait down again – they’re reportedly taking ships, enforcing a US naval blockade & the peace talks have stalled, with that ceasefire thing expiring around April 22. This is sending investors running for the safety of the USD, which is giving the GBP a hard time & keeping the pair down.
- General Mood: The news out of Iran and rising oil prices has got everyone spooked about potential price hikes for the UK, although the Bank of England isn’t in any rush to raise interest rates. Data-wise, the UK has some good news on the GDP front, but it’s the bigger picture that’s really making the headlines.
Outlook
The GBP/USD is very sensitive to whatever’s going on with the Strait of Hormuz and those peace talks. If things calm down, we could see some more optimistic investors taking a chance on riskier assets & that would be good for the GBP. But if things get worse, the USD is likely to keep going up. From a technical point of view, the pair is just hanging out in the 1.3480–1.3600 range.
GBP/USD Technical Analysis
On the 4-hour chart, GBP/USD is just hovering around $1.3507 after a bit of a pullback from the $1.3590 high point. The price action is playing around the 0.5 Fibonacci level at $1.3490. We’ve had a bearish rejection from the 0.236 zone ($1.3548) and then some smaller candles that are making it look like the downtrend is starting to lose steam but not actually reversing.
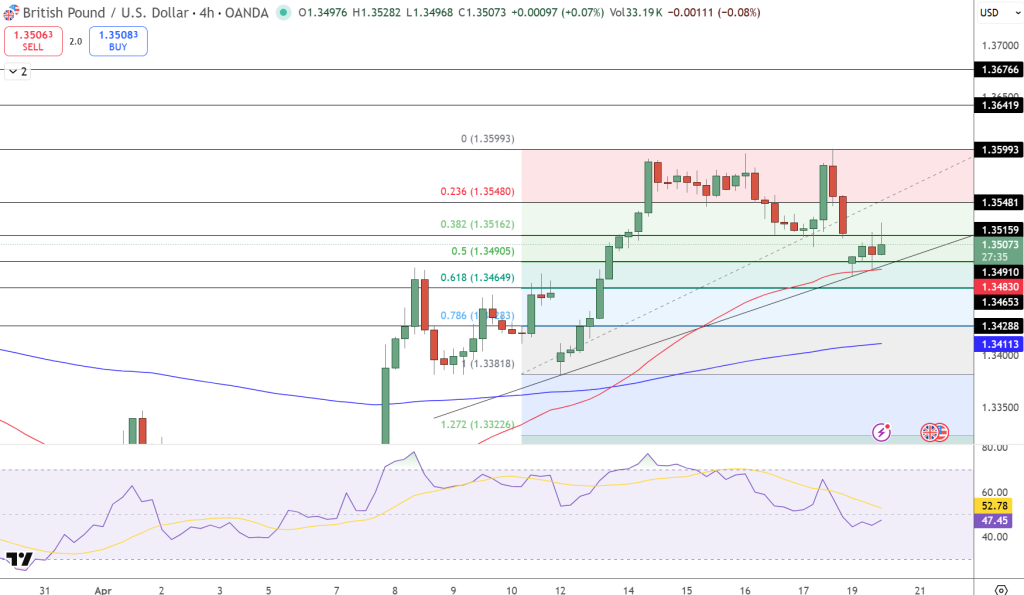
The long term rising trend line that started in early April is still intact and is just about to intersect with the 0.618 Fibonacci level at $1.3490, and also with the 50-period moving average at around $1.3480. The combination of all this is making for a pretty strong support wall here. If that holds, it could set up a new higher low & that would be good for a move back up to $1.3550 or even $1.3590.
If the price goes below $1.3465 though, we’re looking at $1.3428 and then the 200-period moving average at $1.3410.
The RSI is 47, so momentum is neutral and could go either way from here.
Key Levels:
- Resistance: $1.3550 → $1.3590
- Support: $1.3490 → $1.3465 → $1.3410
Trade Idea: Buy above 1.3520, targeting 1.3590, and stop just below 1.3460.
- Check out our free forex signals
- Follow the top economic events on FX Leaders economic calendar
- Trade better, discover more Forex Trading Strategies
- Open a FREE Trading Account
- Read our latest reviews on: Avatrade, Exness, HFM and XM
Related Articles
Sidebar rates
Related Posts
Ava

