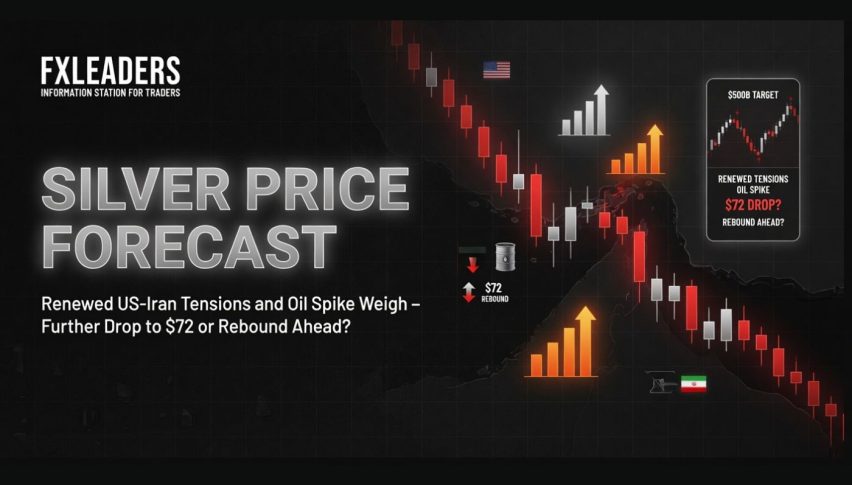
Silver Price Forecast: Renewed US-Iran Tensions and Oil Spike Weigh – Further Drop to $72 or Rebound Ahead?
As of April 24, 2026, mid-morning trading as the NY markets kick into gear, spot silver is hovering around $74.70-$75.50 an ounce...
Quick overview
- As of April 24, 2026, spot silver is trading between $74.70 and $75.50 an ounce, down approximately 0.5-1% today.
- Silver has experienced a significant pullback from its recent highs of $77-$80, with a potential weekly loss of 5-7%.
- Key factors influencing silver prices include geopolitical tensions, a stronger US dollar, and rising bond yields, which are pressuring non-interest paying metals.
- Technical analysis indicates bearish momentum, with support levels around $72.66 and resistance near $75.50-$76.80.
As of April 24, 2026, mid-morning trading as the NY markets kick into gear, spot silver is hovering around $74.70-$75.50 an ounce.
- Recent action: Silver’s taken a bit of a hit today, down a rough 0.5-1% and on track to finish the week in the red – a 5-7% loss. Just yesterday it was hanging around the $77-$80 mark, so this pullback is certainly notable.
- Long-term view: Silver’s still taking breaths easy – it’s up over 120-127% year-on-year, but a far cry from its all-time high of $121-$122 back in January 2026.
Key Drivers today
It’s no surprise that silver’s under similar pressure to gold
- The ongoing tensions in the Middle East between the US and Iran – along with all the Strait of Hormuz drama and blockades – has everyone spooked, sending oil prices soaring and raising inflation concerns that in turn are keeping interest rates higher for longer & weighing on non-interest paying metals.
- The stronger-than-expected US dollar & rising bond yields are also giving silver a rough ride.
- Risk-off sentiment’s taken hold in some sessions, but there are underlying supports – mainly from physical demand: industrial, investment & central bank/China-related flows still seen as stable.
Technical levels:
Think $74-$72 as support levels & $76-$78 as potential resistance points. The gold/silver ratio has settled back to a normal range of around 62-63:1.
Silver (XAG/USD) Technical Analysis
The 2 hour chart is showing silver’s starting to lose its grip: price just slipped below that $75.49 support & is now trading near $74.70, under both the 50 EMA ($77.13) and 200 EMA ($76.84) – which are now acting as a barrier.
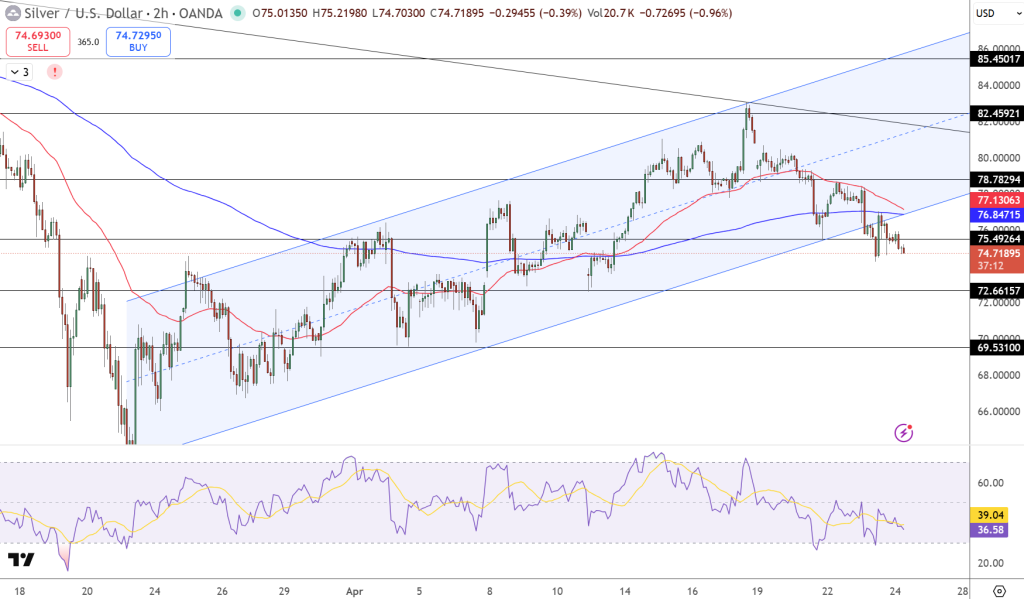
The breakdown from the rising channel that’s been propelling silver upwards since late March has been a turning point. Looking at the $82.45 resistance zone & that clear lower high – the rejection from that level marked the start of some sustained selling pressure. & now the technical picture looks decidedly bearish: lower highs only seem to get lower, momentum seems to be swinging in the sellers’ favour & RSI is reading 36 – not fully oversold yet.
Key Levels:
Think: Resistance $75.50-$76.80 → $77-$78
Support: $72.66 → $69.53
Trade Idea: Sell below $75.00, aiming for $72.66. Stop loss above $76.80.
- Check out our free forex signals
- Follow the top economic events on FX Leaders economic calendar
- Trade better, discover more Forex Trading Strategies
- Open a FREE Trading Account
- Read our latest reviews on: Avatrade, Exness, HFM and XM
Related Articles


Sidebar rates
Related Posts
