FICO stock is testing a critical golden ratio support level at $840 after a significant decline from its all-time high of $2,402.5.
While there are early signs of bullish momentum on the weekly chart, the overall trend structure remains bearish across lower timeframes.
Key resistance levels to watch include $1,058 on the 4-hour chart and $1,303.6 on the weekly chart, which could act as barriers to further upside.
If the $840 support fails, the next major downside target is the 200-month EMA around $601.4.
Fair Isaac Corporation (FICO) stock has been undergoing a sustained correction over the past year, now approaching a critical Fibonacci support zone. With price testing a key technical level, the question becomes: is the downside momentum nearing exhaustion – or is a bullish reversal about to unfold?
FICO Tests Critical Golden Ratio Support as Downtrend Meets Long-Term Structure
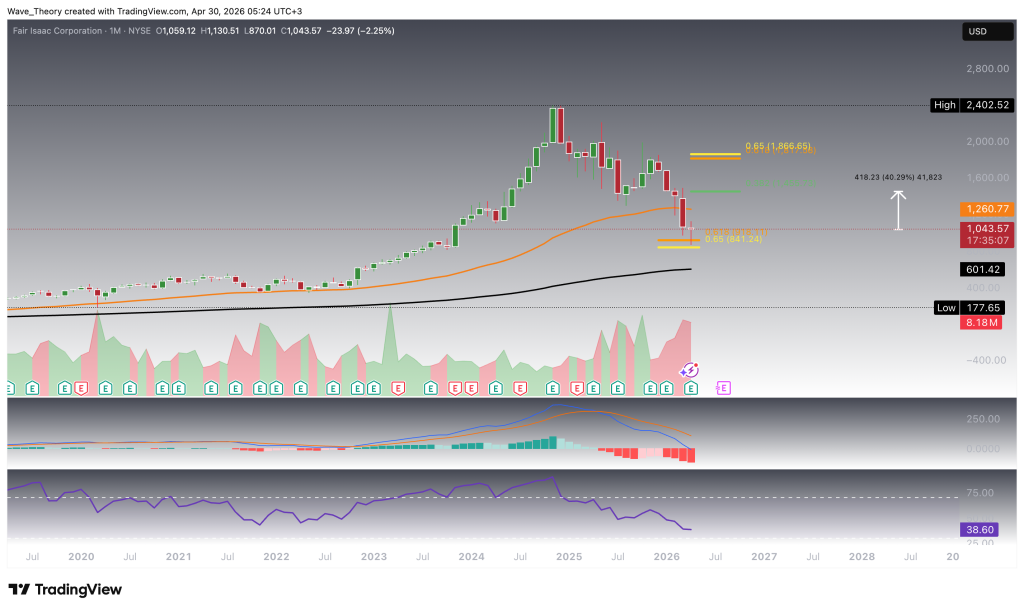
Fair Isaac Corporation (FICO) has undergone a steep corrective phase, declining from its all-time high at $2,402.5 to a recent low of $871, and is now testing a key golden ratio support level at $840. This level represents a critical inflection point: a successful hold could trigger a bullish rebound, with upside targets at the next Fibonacci resistance levels of $1,456 and $1,867—implying potential upside of approximately 40%. However, any recovery is likely to encounter interim resistance at the 50-month EMA, currently positioned at $1,261.
Despite this technically significant support zone, momentum indicators remain predominantly bearish. While the EMAs continue to reflect a golden crossover—maintaining a bullish bias in the long-term trend structure—the MACD lines are bearishly crossed, and the MACD histogram has been declining for four consecutive months, signaling persistent downside momentum. Meanwhile, the RSI remains in neutral territory, offering no clear directional bias at present.
Should the $840 golden ratio support fail to hold, the technical outlook would deteriorate further, exposing the next major downside level at the 200-month EMA around $601.4, which would serve as the next significant long-term support zone.
FICO
Bullish Momentum Builds on the Weekly Chart, Signaling Potential Rebound
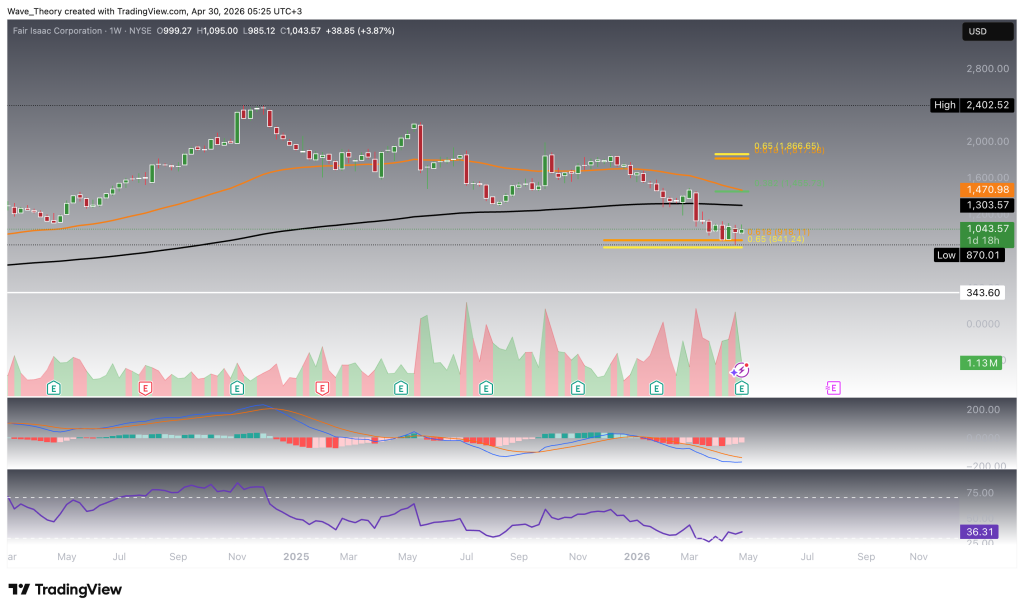
On the weekly timeframe, Fair Isaac Corporation (FICO) is beginning to show constructive signs of a potential trend reversal. The MACD histogram has been ticking bullishly higher for three consecutive weeks, indicating a steady build-up in upward momentum, while the MACD lines are on the verge of a bullish crossover—often an early confirmation of a shift in trend direction.
At the same time, the RSI remains in neutral territory, suggesting there is ample room for upside expansion without immediate overbought constraints. Supporting this outlook, the EMAs continue to display a golden crossover, reinforcing a bullish bias in the mid-term structure.
Should FICO initiate a sustained bounce from current levels, the first key resistance zones are defined by the 200-week EMA at $1,303.6 and the 50-week EMA at $1,471. These levels are likely to act as significant technical barriers where price could face rejection or consolidation before any further upside continuation.
FICO
Downward Channel Dominates Daily Structure Despite Early Bullish Momentum Signals
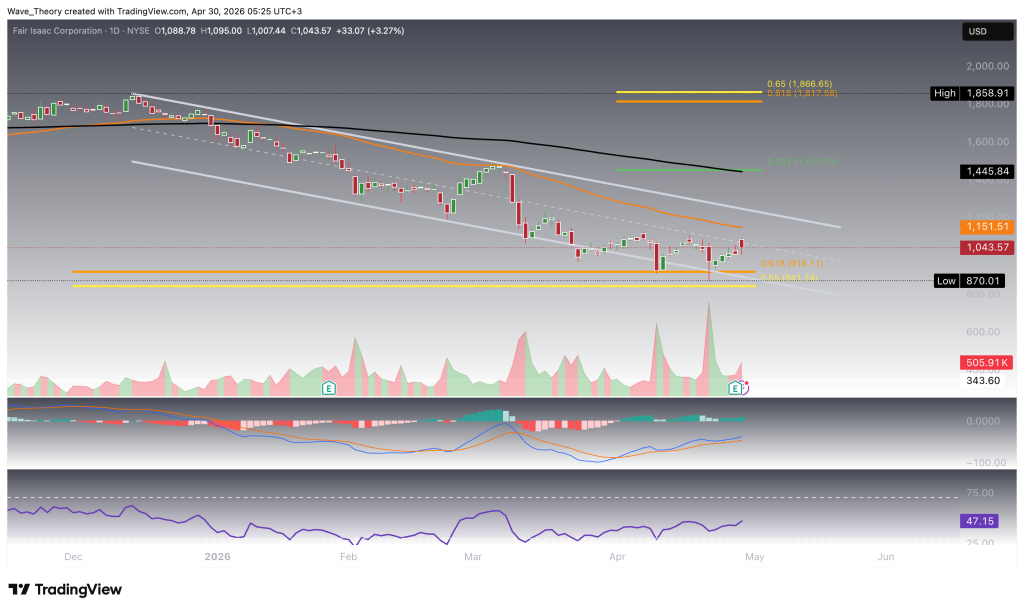
On the daily timeframe, Fair Isaac Corporation (FICO) remains firmly embedded within a well-defined downward channel, underscoring a prevailing bearish structure. This is further reinforced by the formation of a death cross in the EMAs, confirming downside trend alignment across the short- to medium-term horizon.
However, momentum indicators are beginning to diverge from this bearish structure. The MACD lines have crossed bullishly, accompanied by a rising MACD histogram, signaling a pickup in short-term upside momentum. Meanwhile, the RSI remains in neutral territory, indicating neither overbought nor oversold conditions and leaving room for directional expansion.
Should FICO extend its current short-term recovery, key resistance levels come into focus at the 50-day EMA near $1,151.51 and the 200-day EMA at $1,445.84. Notably, the 200-day EMA aligns closely with the 0.382 Fibonacci resistance, creating a strong confluence zone that is likely to act as a significant barrier to further upside.
FICO
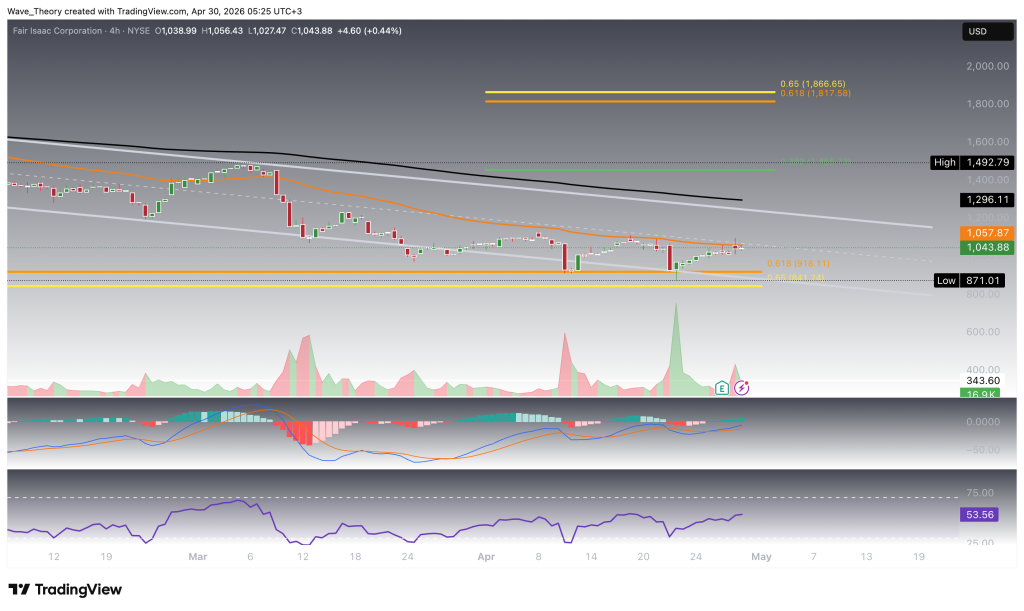
FICO Stock Tests 4H Resistance as Mixed Signals Define Short-Term Outlook
On the 4-hour chart, Fair Isaac Corporation (FICO) is currently challenging the 50-4H EMA at $1,058—a level that has already acted as resistance following a recent rejection. A confirmed breakout above this barrier could open the door for a continuation move toward the 200-4H EMA at $1,296, marking the next key upside target in the short term.
For a broader structural shift and invalidation of the prevailing downtrend, FICO would need to reclaim the golden ratio level at $1,867, which remains the critical threshold for a full bullish reversal.
In terms of momentum, the signal landscape remains mixed. The EMAs continue to reflect a death cross, reinforcing the bearish trend structure. However, this is counterbalanced by improving momentum indicators: the MACD lines are bullishly crossed, the MACD histogram is trending higher, and the RSI remains neutral—suggesting that while the trend is still bearish, short-term upside attempts are gaining traction.
FICO
FICO Stock a Make-or-Break Level Between Structural Weakness and Reversal Potential
Fair Isaac Corporation (FICO) is currently positioned at a critical technical inflection point after a prolonged correction from $2,402.5 to sub-$900 levels. Price is testing the golden ratio support at $840, a level that could define the next major directional move. While higher timeframes—particularly the weekly chart—are beginning to show early signs of bullish momentum recovery, the broader structure across the daily and lower timeframes remains bearish, with price still trading within a downward channel and below key moving averages.
In summary, momentum is gradually improving, but trend structure remains fragile. A confirmed hold above $840 combined with reclaiming key EMA resistances would shift the bias bullish, while a breakdown below support would likely extend the macro correction.
Konstantin Kaiser comes from a data science background and has significant experience in quantitative trading. His interest in technology took a notable turn in 2013 when he discovered Bitcoin and was instantly intrigued by the potential of this disruptive technology.