Gold Price Forecast: What to Expect from Today’s CPI and How to Trade It; Eyes on $4,000
Bullion has finished pre-data positioning, squeezing in an extremely nervous consolidation zone. Wednesday, June 10, 2026: Spot gold...
Quick overview
- Bullion is in a nervous consolidation zone ahead of the May CPI report, with spot gold steady at $4,328/oz.
- Economists expect headline CPI to rise to 4.2%, while core CPI is projected to slightly decrease to 2.9%.
- Gold's price action is currently forming a symmetrical triangle, indicating a potential $200 directional move based on CPI data.
- The outcome of today's CPI report will significantly influence trading strategies for gold, with potential bullish and bearish setups outlined.
Bullion has finished pre-data positioning, squeezing in an extremely nervous consolidation zone. Wednesday, June 10, 2026: Spot gold was steady in early trading at $4,328/oz. Commercial desks are adamant about not moving gold out of this range ahead of the Bureau of Labor Statistics releasing the May CPI number at 8:30 am ET. The risk profile of a possible spike in inflation is further complicated by escalating violence in the Middle East.
A U.S. Apache military helicopter was shot down by the Iranian military in the Strait of Hormuz overnight yesterday while U.S. CENTCOM launched immediate retaliatory attacks on Qeshm Island. Inevitable capital flows into safe haven physical gold are colliding with a hawkish domestic interest rate environment. In addition, a 172k nonfarm report on Friday, this week’s CPI print will be a final vote for new Fed Chairman Kevin Warsh before the June 16-17 FOMC.
What Wall Street Expects from the May CPI Report
Consensus projections from global investment banks show that inflation is proving incredibly sticky, largely fueled by rising maritime insurance premiums and logistics bottlenecks:
- The Headline Inflation Metric: Economists expect year-over-year headline CPI to accelerate to a hot 4.2%, up significantly from April’s 3.8% print, reflecting sustained commodity and energy pressures.
- The Core Inflation Baseline: Core CPI, which strips out volatile food and energy inputs, is forecast to edge down slightly to a sticky 2.9% year-over-year, remaining well above the Fed’s long-term target.
- The Policy Reaction Function: A hot report today will arm Chair Warsh with all the macroeconomic leverage he needs to preserve an unyielding, higher-for-longer policy posture, with fixed-income desks actively preparing for a potential interest rate hike later this summer.
Gold (XAU/USD) How to Trade Today’s Triangle Apex Squeeze
Looking at the daily time-frame technical charts instead of the fundamental drivers of gold’s current trading activity, the multi-month range bound trading price action is currently compressing into a large scale symmetrical triangle formation that is primed to have its next move, with a significant $200 directional move in either direction to the upside or downside in price action.
Triangle Symmetrical Form
Gold ($4,328.31) is currently touching off the support side of the ascending trendline on this massive symmetrical triangle structure. Price is currently trapped in between the 200-day exponential moving average, a $4,379 dynamic support level, with resistance at the 50-day exponential moving average sitting at $4,590.
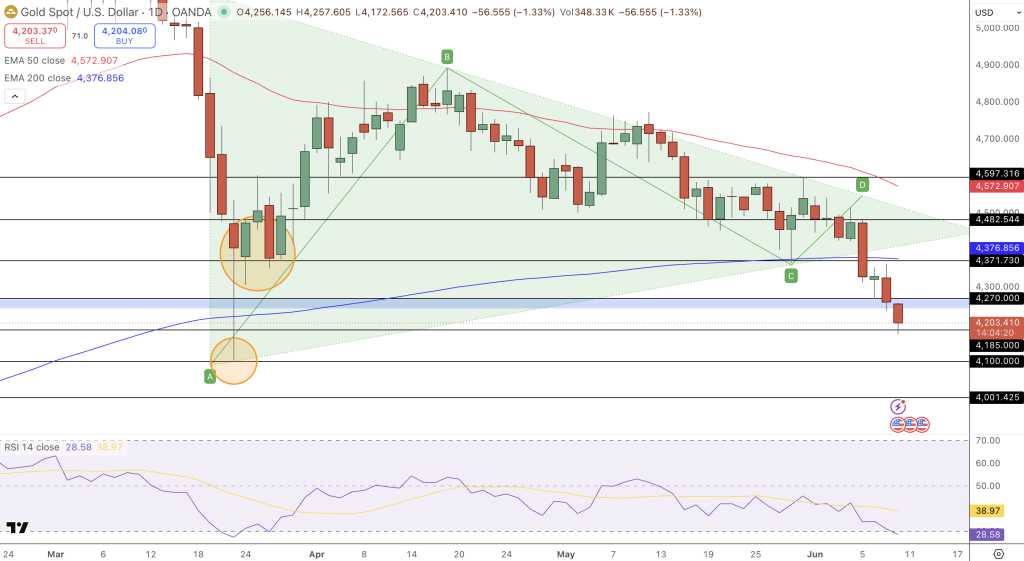
Bearish Trade Setup
Should today’s CPI print be stronger than the 4.2% consensus, the U.S. Dollar Index will spike higher, leading to a breakout and volume decline of gold in price action below this trendline support level. Shorting the trend continuation trade will be initiated from below $4,307, stop losses will be set above $4,368, the initial target will be $4,185 and the ultimate primary channel support target will be $4,000 in the event of a strong macro downside trade.
Bullish Trade Setup
However, should we receive a lower priced print of CPI data than the 4.2% expectation, the CPI print will be lower than the consensus, which will lead to a fall in real yield rates, leading to an explosive short covering rally in gold. Long trades will be entered in the event of a daily time-frame close above $4,368 with a tight stop loss being set beneath the triangle trendline support at $4,307, with an ultimate primary structural upside target in the next move in gold in price action to be a target of $4,515 in the next move.
At the end of the day, gold will serve as the primary global release mechanism. For now though, the intraday directional path will be determined entirely by the release of the CPI data at 8:30 AM ET. In reality, the PBoC is buying gold non-stop for the 17th consecutive month now, as seen on the PBoC gold purchase history, so we know that any deeper macro level correction in gold’s macro path in price action will be absorbed by physical gold buying from major institutions as we move deeper into the second half of the year of 2026.
- Check out our free forex signals
- Follow the top economic events on FX Leaders economic calendar
- Trade better, discover more Forex Trading Strategies
- Open a FREE Trading Account
- Read our latest reviews on: Avatrade, Exness, HFM and XM
Related Articles


Sidebar rates
Related Posts
Ava

