SMCI Stock (Super Micro Computer) Prediction: Is a 35% Correction Still Possible?

Quick overview
- Super Micro Computer (SMCI) has experienced a significant rally of over 33,700% from its historical low, reaching an all-time high of $122.90 before entering a corrective phase.
- Despite the recent decline, the long-term market structure remains bullish, but momentum indicators suggest continued bearish pressure.
- Key support levels are being tested around $27.20, with a potential decline toward $17.25 if this support fails.
- For a positive shift in the technical outlook, SMCI needs to reclaim the 50-day and 200-day EMAs, currently indicating a bearish trend.
Super Micro Computer (NASDAQ: SMCI) has entered an extended consolidation after one of the strongest rallies in the AI sector over recent years. Following a remarkable gain of more than 33,700% from its historical low, the stock reached an all-time high of $122.90 before entering a prolonged corrective phase.
Despite the sharp decline, the broader market structure remains constructive. However, momentum indicators across the weekly, daily, and 4-hour timeframes continue to favor the bears, suggesting the correction may not be over yet. Investors are now closely watching whether SMCI can defend its key support around $27 or if the stock will extend its decline toward the cycle low support at $17.25.
SMCI Stock Has Rallied More Than 33,700% Since Its Historical Low
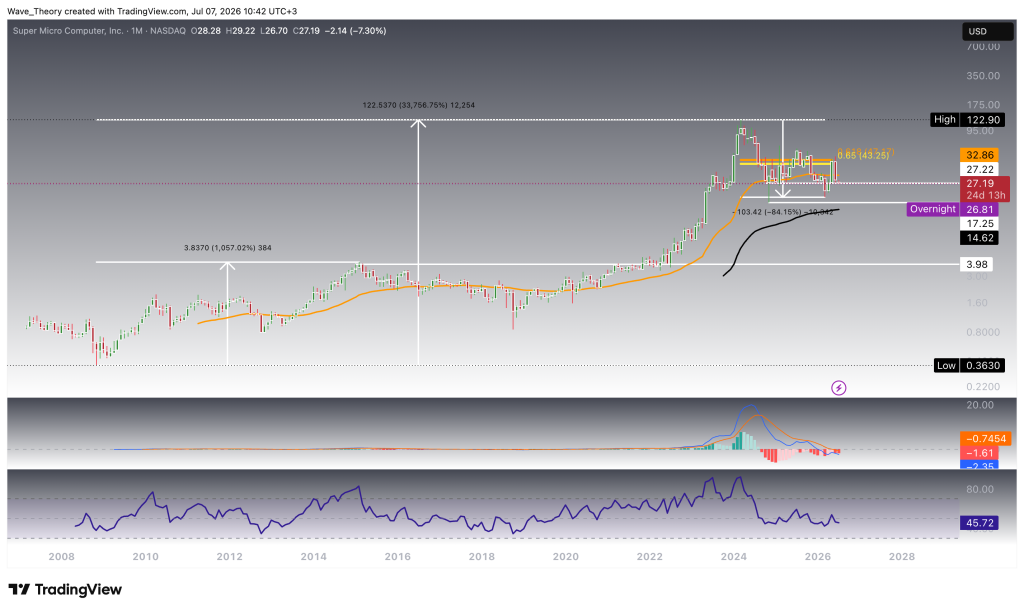
On the monthly chart, Super Micro Computer has delivered one of the strongest long-term rallies in the semiconductor sector, climbing more than 33,756% from its historical low of approximately $0.36 to an all-time high at $122.90.
Following this parabolic advance, the stock entered a deep correction and has already retraced more than 84% from its record high. Despite this decline, the long-term structure remains bullish.
The first major Fibonacci resistance now sits between $43.25 and $43.77, while the 50-month EMA provides dynamic support near $32.86. The 200-month EMA continues rising around $14.62, reinforcing the long-term bullish trend.
Meanwhile, the MACD lines remain bearishly crossed, while the MACD histogram continues to weaken, reflecting fading bullish momentum. The RSI remains neutral around 46, providing no significant directional signal.
Weekly Chart Signals Further Downside Risk For Super Micro Computer Inc.
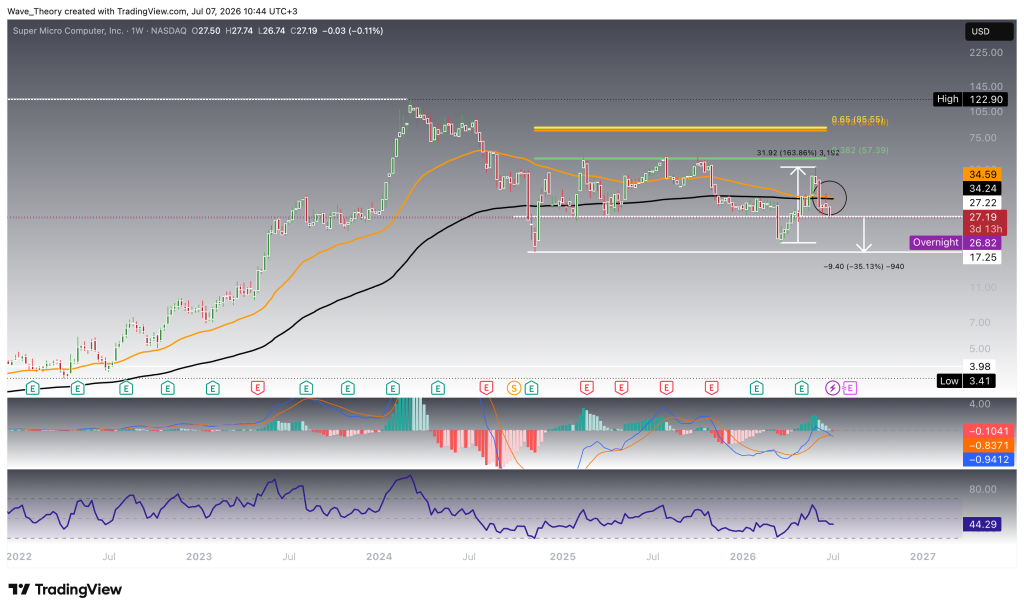
On the weekly chart, SMCI continues trading below both the 50-week EMA and the 200-week EMA, highlighting persistent medium-term weakness. The EMAs are about to form a death cross, which would confirm the trend bearishly in the mid-term.
The stock recently failed to sustain a recovery above the moving averages and has once again turned lower. Immediate support sits around $27.20, while the next major downside target lies at the cycle low $17.25. A decline toward this level would imply approximately 35% downside from current prices.
On the upside, the first significant resistance remains the 0.382 Fibonacci level at $57.39, while the next major Fibonacci resistance zone is located between $82.19 and $85.55. Only a bullish break of that level invalidates the ongoing correction phase.
Momentum indicators remain bearish. The MACD lines are bearishly crossed, and the MACD histogram has started ticking lower again after briefly improving. Meanwhile, the RSI remains in neutral territory near 44, offering neither bullish nor bearish divergence.
Daily Chart Remains Bearish Below Key Moving Averages
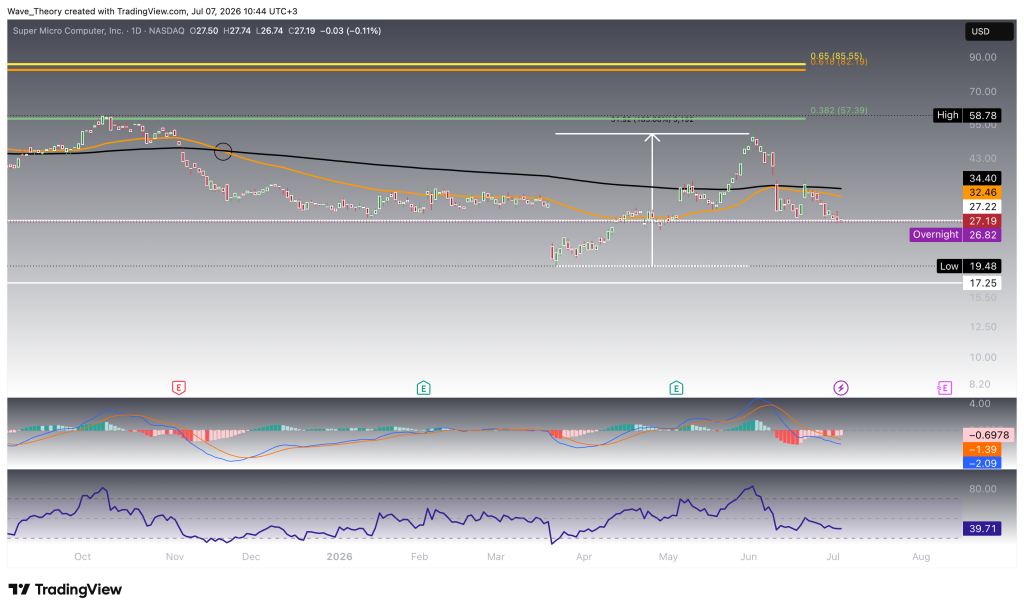
On the daily chart, SMCI stock continues to trade below both the 50-day EMA at $32.46 and the 200-day EMA at $34.40. The death cross of the EMAs confirms that the short- to medium-term trend remains bearish.
The stock has already rejected the moving averages multiple times, reinforcing this resistance zone. Immediate support remains at approximately $27.20, followed by cycle low at $17.25 if selling pressure accelerates.
The MACD lines remain bearishly crossed, while the MACD histogram starts printing higher values. Meanwhile, the RSI has declined toward 40, moving towards oversold territory without generating a bullish reversal signal, although the RSI is forming a slight bullish divergence.
Only a sustained break above both daily moving averages would significantly improve the short-term technical outlook. From its last significant low at $19.5, the price already climbed by roughly 164% to form a local high at $51.4. Nonetheless, the Fib resistances remained untouched, leaving the stock in an ongoing correction phase.
Short-Term Recovery Faces Strong Resistance
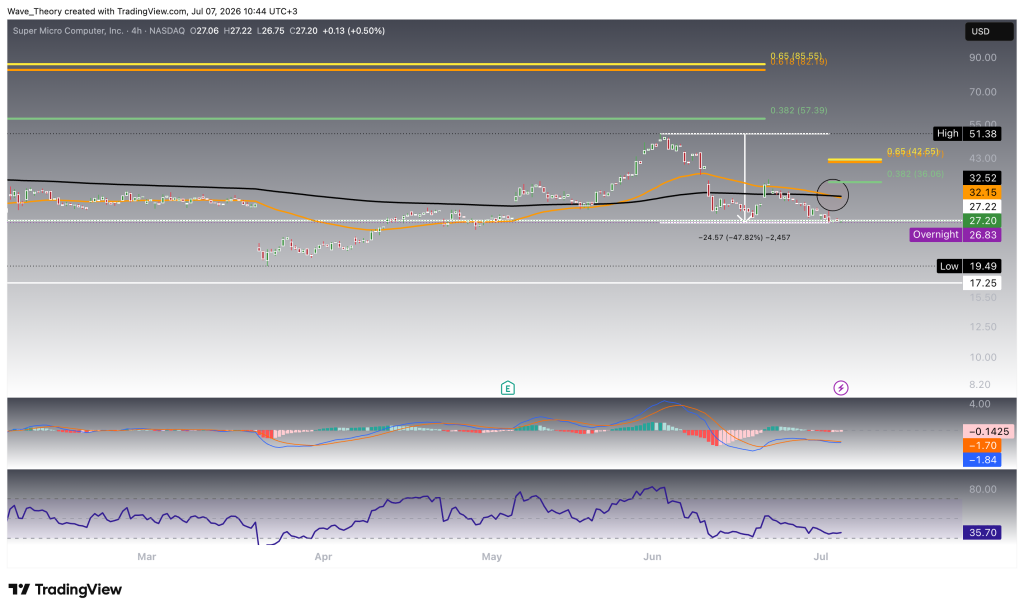
On the 4-hour chart, SMCI stock is attempting to stabilize after its recent sell-off. However, the stock continues facing significant resistance from both the 50-period EMA near $32.15 and the 200-period EMA around $32.52. The EMAs are about to form a death cross, which confirms the trend bearishly in the short-term.
Above these levels, the next resistance sits at the 0.382 Fibonacci retracement around $36.06, followed by the Golden Ratio resistance near $42.57.
Momentum indicators remain weak. The MACD lines are still bearishly crossed, although the MACD histogram has started ticking slightly higher, suggesting bearish momentum is beginning to fade. Meanwhile, the RSI remains subdued near 36 and forms a bullish divergence, which could catapult the price towards the EMA levels in the short-term.
As long as SMCI trades below both key moving averages, the short-term outlook remains bearish. A decisive break above the EMA resistance zone would be the first indication that bullish momentum is returning.
Super Micro Computer (SMCI) Price Prediction: Summary
Super Micro Computer remains in a long-term bullish market structure despite correcting more than 77% from its all-time high. However, momentum indicators across the weekly, daily, and 4-hour charts continue to favor the bears, suggesting the corrective phase may not be over.
The stock is currently testing key support around $27.20. A break below this level could expose the Golden Ratio support at $17.25, representing roughly 35% downside. On the upside, SMCI must reclaim the 50-day and 200-day EMAs before the technical outlook begins to improve. As long as the stock holds above $17.25, the broader bullish market structure remains intact.
- Check out our free forex signals
- Follow the top economic events on FX Leaders economic calendar
- Trade better, discover more Forex Trading Strategies
- Open a FREE Trading Account
- Read our latest reviews on: Avatrade, Exness, HFM and XM

Related Articles



Sidebar rates

Related Posts
 Save
Save